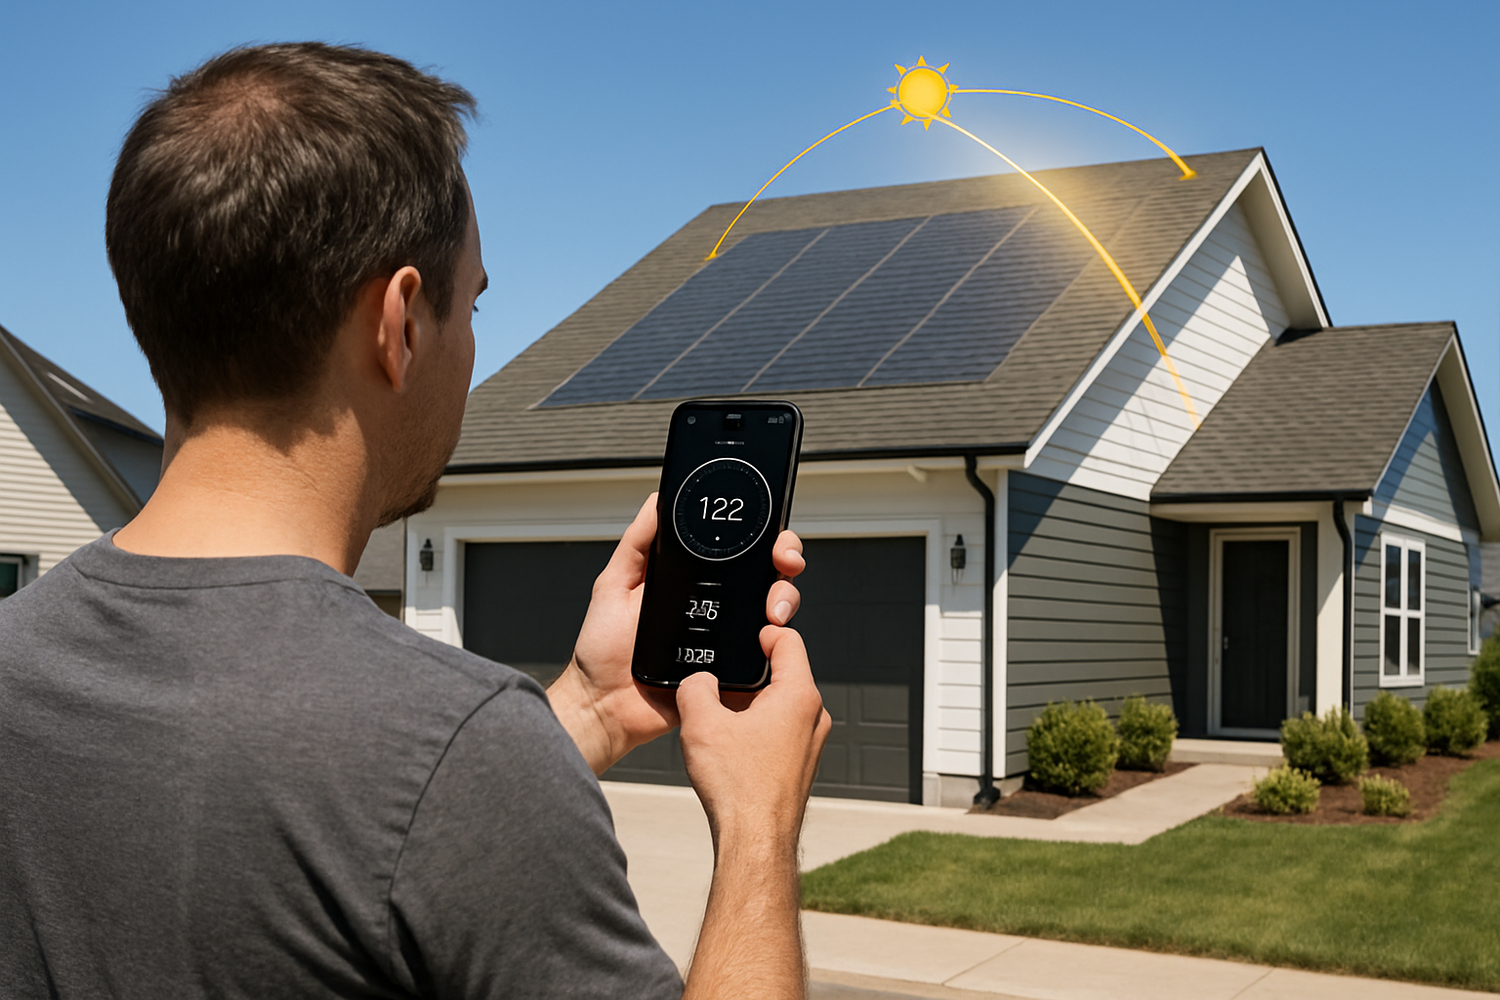
You don’t need a drone survey to get a clear first answer to “Is my roof good for solar?” Run this fast, data-led home solar assessment. You will walk away with a roof fit score, a rough kWh estimate, and a storage hint you can hand to any installer. It takes about 30 minutes and zero ladders.

How this at‑home Solar Suitability Test works
Tools you already have
- Smartphone with compass and inclinometer apps, plus satellite map
- Electric bill (kWh and tariff details)
- Tape measure or pacing steps (to estimate roof area)
- Notepad
What you’ll get
- A pass/hold/no-go signal for solar panel installation eligibility
- A DC system size estimate (kW) and annual output estimate (kWh)
- A quick storage suitability hint based on your usage and tariff
Solar is highly modular and can fit small rooftops as well as large sites. This modularity is a core strength of PV, noted by public agencies such as Energy.gov and the IEA.
Step 1 — Shade and sun‑window check
5‑minute ground check
- Stand on the street side between 10:00 and 14:00. Look for trees, chimneys, and second‑story walls casting shade onto the target roof.
- Shadow length ratio: if tree shadows reach more than half the roof height for much of midday, expect notable shade losses.
Satellite view cross‑check
- Open a satellite map. Trace the rectangle of unshaded, panel‑friendly roof (avoid vents, skylights, and ridge setbacks).
- Note nearby tall objects south, east, and west that can cast morning or afternoon shade.
Shade score
- 0–5% of target area shaded at midday: Shade factor ≈ 0.98–1.00
- 5–15% shaded: Shade factor ≈ 0.90–0.95
- 15–30% shaded: Shade factor ≈ 0.80–0.90
- >30% shaded: consider trimming or alternate roof faces
East–west layouts can still be strong candidates. The IEA’s Next‑Generation Wind and Solar notes DC/AC design choices and east–west orientation can improve system friendliness and timing, not just south‑facing configurations.
Step 2 — Area, tilt, and orientation in minutes
Usable area
Measure the length and height of the open roof rectangle by pacing or with a tape. Convert to square meters (m²). As a rule of thumb, 1 kW of PV needs about 6–8 m² on typical high‑efficiency modules. Use 7 m²/kW for a conservative estimate.
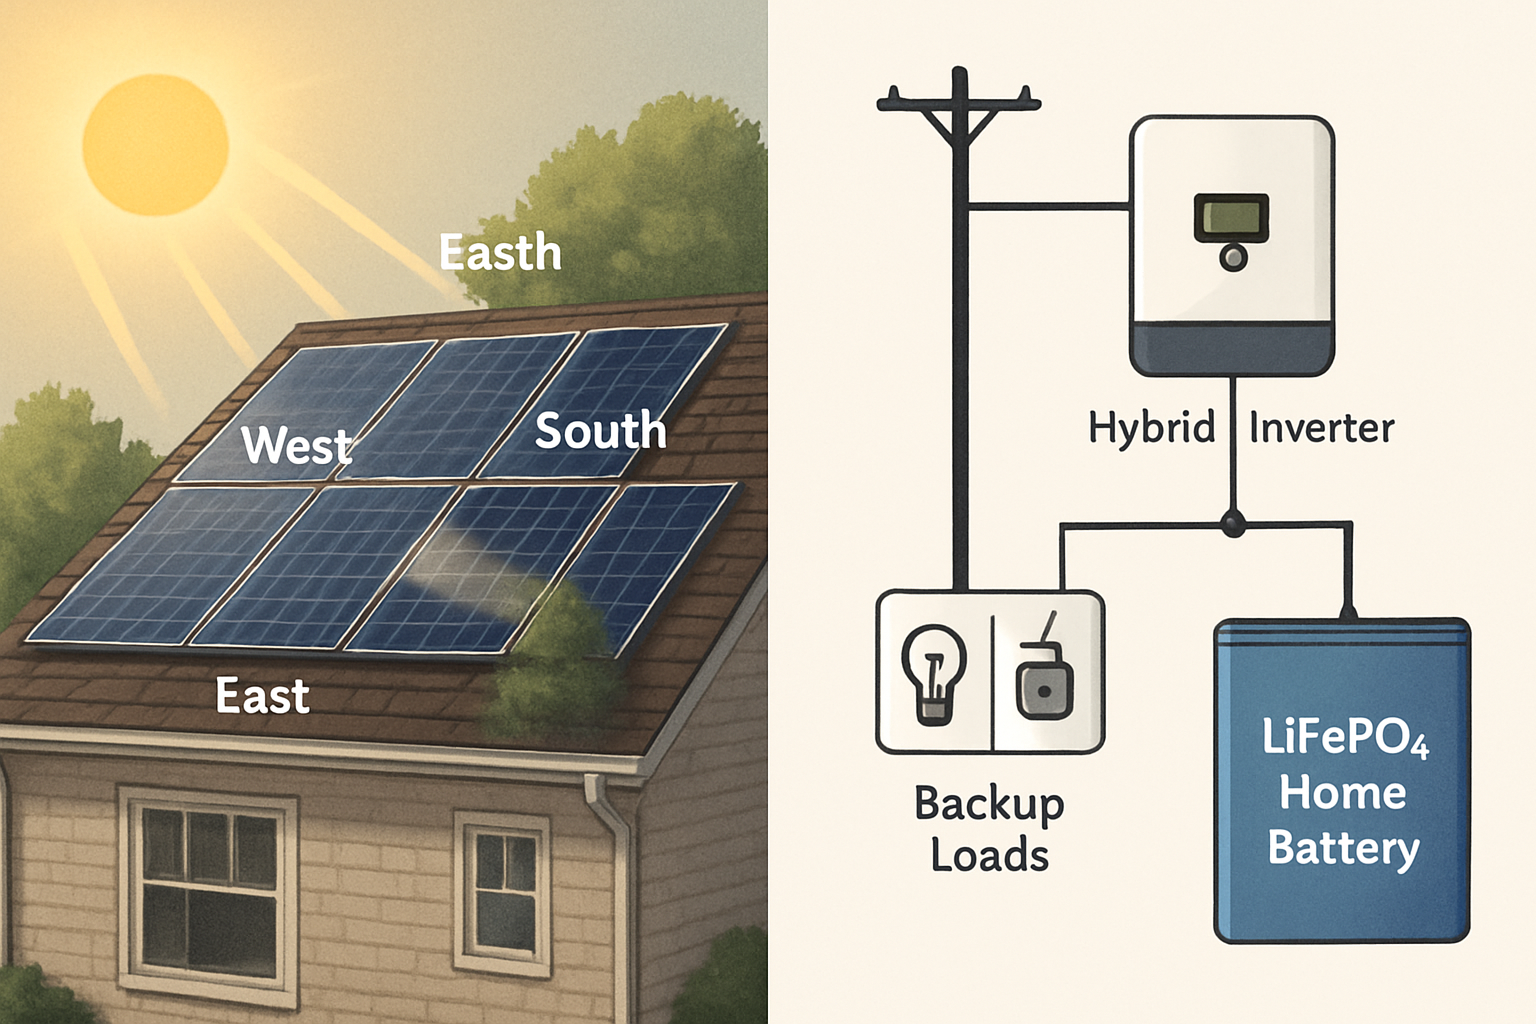
Orientation and tilt
- Use your phone compass to read azimuth. In the northern hemisphere, south ≈ 180°, east ≈ 90°, west ≈ 270°. Reverse for the southern hemisphere.
- Use a phone inclinometer at the eave or a side wall to estimate roof tilt (degrees from horizontal).
Orientation/tilt factor (quick reference)
| Roof orientation | Typical tilt | Relative yield factor | Notes |
|---|---|---|---|
| South (N. hemisphere) / North (S. hemisphere) | 15–35° | 0.98–1.00 | Near‑optimal annual yield |
| SE/SW or NE/NW | 10–35° | 0.93–0.98 | Small loss, better morning/evening timing |
| East or West | 5–25° | 0.85–0.93 | Often aligns with time‑of‑use tariffs |
| Flat | 0–5° (ballasted tilt) | 0.90–0.98 | Tilted racking recovers yield, watch spacing |
| North (N. hemisphere) / South (S. hemisphere) | 10–30° | 0.65–0.80 | Usually a secondary choice |
Energy agencies highlight that orientation shapes the timing of output. East–west can curb mid‑day peaks and better match household loads. See the IEA report for system‑friendly design context.
Step 3 — Estimate annual output with a simple formula
Pick a regional “specific yield” and apply small correction factors. You’ll get a realistic first‑pass kWh figure for your residential solar potential.
- Cloudier/coastal climates: 900–1,100 kWh per kW‑year
- Temperate/sunny: 1,100–1,300 kWh per kW‑year
- High‑irradiance: 1,400–1,700 kWh per kW‑year
These ranges align with public sources such as Energy.gov and long‑run international assessments by the IRENA.
Formula
Annual kWh ≈ System kW × Regional yield × Orientation/Tilt factor × Shade factor × System factor (0.80)
- System kW = Usable area (m²) ÷ 7
- System factor captures losses (soiling, wiring, temperature). 0.80 is a common first pass.
- Designers may use a DC/AC ratio around 1.15–1.35 to keep inverters efficient without big clipping. See historical DC/AC trends in the IEA report.
Step 4 — Electrical and roof red‑flag self‑check
Do not remove panel covers or climb the roof. This is a visual screen only.
- Service panel label: Note main breaker rating (e.g., 100 A, 150 A, 200 A) and spare breaker spaces. Modern homes with 200 A service often integrate PV easily; 100 A can still work with design tweaks. Local code applies.
- Panel condition: No scorching, corrosion, or obvious damage.
- Roof surface: No widespread curling, soft spots, or active leaks. If the roof is near end‑of‑life, consider coordinating replacement with PV to save a future remove‑and‑reset trip.
More on safe, standards‑aligned solar choices is available from Energy.gov. For broader energy cost context, see the EIA consumer data hub.
Safety disclaimer: This home solar assessment is informational and not structural, electrical, or legal advice.
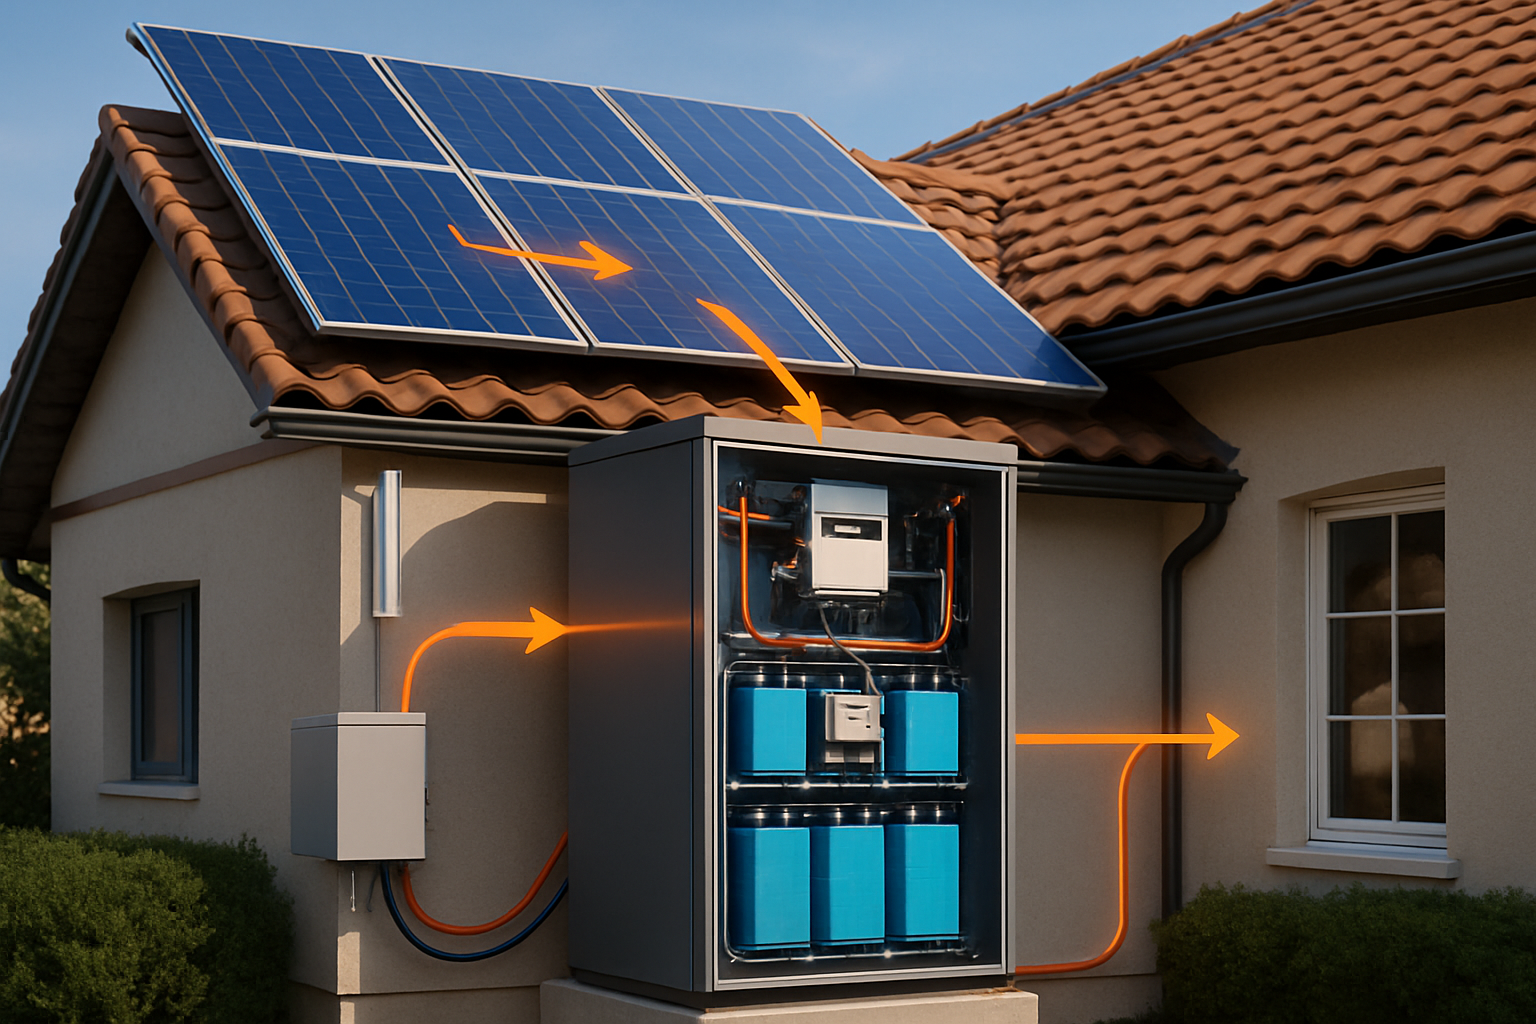
Step 5 — Storage fit in 60 seconds
- Time‑of‑use or high evening rates? A battery can shift your mid‑day PV to evening, boosting self‑consumption and limiting exports.
- Frequent outages? Storage adds resilience by keeping critical loads on.
- Typical home batteries range 5–15 kWh. LiFePO4 chemistry is common for safety and cycle life in modern residential ESS.
The IEA notes that pairing rooftop PV with storage reduces reverse power flows and raises on‑site use. Public analyses by Energy.gov also highlight how distributed storage supports flexible load profiles.
Scorecard—turn your notes into a decision
| Category | Your notes | Score | How to score |
|---|---|---|---|
| Sun window & shade | Midday shade % | 0–35 | 0–5% shade = 35; 5–15% = 25–30; 15–30% = 15–25; >30% = 0–15 |
| Usable area | m² and kW estimate | 0–25 | >28 m² (≈4 kW) = 25; 14–28 m² (≈2–4 kW) = 10–20; <14 m² = 0–10 |
| Orientation/tilt | Azimuth, degrees | 0–20 | Optimal (S at 15–35° or flat with tilt) = 18–20; E/W = 12–17; N = 0–10 |
| Electrical panel | Service rating, space | 0–10 | 200 A & spare spaces = 8–10; 100–150 A or tight space = 3–7; visible issues = 0–2 |
| Roof condition | Age, surface health | 0–10 | Good/new = 8–10; fair = 4–7; near EoL = 0–3 |
- 70–100: Strong candidate. Move to quotes and site visit.
- 50–69: Likely viable with tweaks (trim branches, choose the better roof face, consider microinverters).
- <50: Address shade/roof issues first or consider a smaller array plus storage for targeted goals.
Two quick worked examples
Example A — East roof, light shade
- Usable area: 35 m² → ≈5 kW DC
- Region yield: 1,200 kWh/kW‑yr
- Orientation factor: 0.90 (east)
- Shade factor: 0.95 (≈5–10% shade)
- System factor: 0.80
Annual kWh ≈ 5 × 1,200 × 0.90 × 0.95 × 0.80 = ≈4,104 kWh. If your annual use is 8,000 kWh, this covers ~51%. Pairing a 7–10 kWh LiFePO4 battery can shift more mid‑day energy into the evening, increasing on‑site use. The IEA notes this reduces grid back‑feed and improves alignment with household demand.
Example B — South roof, heavy afternoon trees
- Usable area: 28 m² → ≈4 kW DC
- Region yield: 1,350 kWh/kW‑yr
- Orientation factor: 0.98 (south)
- Shade factor: 0.80 (≈20–25% shade)
- System factor: 0.80
Annual kWh ≈ 4 × 1,350 × 0.98 × 0.80 × 0.80 = ≈3,386 kWh. Trimming two branches could lift the shade factor to 0.92, raising output to ≈3,895 kWh—about a 15% gain for minimal cost. Module‑level power electronics can also recover part of shade losses during partial obstruction, a strategy aligned with distributed energy best practices noted by Energy.gov.
Make sense of tariffs and timing
Many utilities use time‑of‑use pricing. East–west arrays often align better with morning and late‑day consumption, even if their annual kWh is slightly lower than a south array. The IEA report highlights the system value of such profiles, and EIA datasets show rate structures vary widely by region. If your evening rate is high, a modest battery may improve bill savings and resilience.
Why this test works—and its limits
- The method mirrors professional pre‑screening: geometry, shading, size, and basic electrical fit. PV’s modularity makes small areas useful, not just perfect roofs (noted by Energy.gov).
- Public research shows design choices matter as much as raw orientation. East–west, sensible DC/AC ratios, and smart controls can improve on‑site use. See IEA.
- At national and city scales, agencies use GIS and policy simulators to rank PV potential. That logic—resource and constraints—scales down to your roof. For context, explore IRENA assessments.
What this test does not replace: structural engineering, detailed electrical review, interconnection rules, permits, HOA approvals, and warranty coordination. See Energy.gov for standards and policy context. This content is informational only and not legal advice.
Next moves
- Save your score, formula inputs, and satellite snapshot.
- Ask installers for quotes based on your kW estimate, plus alternatives (east–west vs south, module‑level electronics, and a 5–10 kWh storage option).
- Request a production guarantee band that matches your quick estimate. It’s a good calibration check.
Stop overthinking. A fast solar suitability test anchors the conversation in numbers, not guesswork. With a clear fit score and an annual kWh range, you can negotiate design choices confidently and move forward toward reliable, scalable energy at home.
Sources and context
- Energy.gov — Solar Energy: Public guidance on rooftop PV, storage, and standards
- IEA — Next‑Generation Wind and Solar Power: Orientation timing, DC/AC ratios, and system‑friendly design
- EIA: U.S. energy data, rates, and consumer statistics
- IRENA: Global PV potential, planning tools, and deployment insights
Leave a comment
All comments are moderated before being published.
This site is protected by hCaptcha and the hCaptcha Privacy Policy and Terms of Service apply.