Thinking about home solar but unsure if your roof and wiring make sense? Use these nine checks to judge Home Solar Suitability with practical thresholds, simple measurements, and data-backed context. You will see how sunlight exposure, roof angle, shading, tariffs, and storage shape real output and savings without hype.

1) Sunlight Exposure by Location
Sunlight varies by region and affects annual kWh per kW of PV. Typical residential PV capacity factors across U.S. regions range roughly from mid-teens to mid-twenties, driven by weather and latitude. That translates to about 1,200–2,300 kWh per kW each year.
Signals from public agencies point to broad rooftop potential. Rooftop PV is highly modular and deployable on homes and small buildings, a point emphasized in Energy.gov: Solar Energy and echoed in Solar Energy Perspectives by the IEA, which highlights PV’s modular nature and diverse siting options.
Typical Yield Ranges
| Region | Typical PV Capacity Factor | Annual Yield per kW (kWh) | 6 kW Example (kWh/yr) |
|---|---|---|---|
| Northeast | 14–16% | 1,225–1,400 | 7,350–8,400 |
| Midwest | 15–18% | 1,300–1,575 | 7,800–9,450 |
| South | 17–20% | 1,490–1,750 | 8,940–10,500 |
| Southwest | 20–26% | 1,750–2,280 | 10,500–13,680 |
| Pacific Coast | 16–20% | 1,400–1,750 | 8,400–10,500 |
These ranges align with capacity-factor signals seen in public datasets and summaries similar to those referenced by the IEA and EIA. For context on energy-system trends and PV roles, see IEA and EIA.
2) Roof Area and Usable Layout
Most homes need 5.5–7.5 m² of clear roof per kW, depending on module efficiency and spacing. As a quick check, a 6 kW system using ~400 W modules (about 1.9 m² each) needs roughly 15 panels and ~28–32 m² of usable area after setbacks. Count vents, chimneys, skylights, and the required fire setbacks to get net usable area.
- Minimum contiguous rectangle: aim for runs of 3–4 modules high to keep wiring and racking efficient.
- Multiple planes work: mixing two arrays on different planes can preserve aesthetics without large production loss.
- Ground or carport options exist if roof space is tight.
IEA notes that PV is form-factor flexible, enabling rooftop, carport, and brownfield siting, broadening deployment options (Solar Energy Perspectives).
3) Shading and Surroundings
Trees, nearby buildings, chimneys, and even parapets can cut output. Check the sun path in summer and winter. If annual shade loss is under ~10–15%, most projects still pencil. Over ~20%, you can still proceed with design tweaks:
- Use module-level power electronics (MLPE) to isolate shaded modules.
- Split arrays across less shaded planes.
- Trim branches with an arborist’s plan and permit.
Energy.gov highlights that proper equipment and design keep PV productive even with partial shade, especially with modern inverters and MLPE (Energy.gov: Solar Energy).
4) Roof Structure, Loads, and Materials
Residential PV adds roughly 2–4 psf (9.8–19.5 kg/m²) dead load for flush-mounted systems. Ballasted flat-roof systems can be higher. Local code also considers wind uplift and snow loads. A structural assessment is smart for older homes or heavy tile roofs.
- Framing: verify rafter sizes, spacing, and roof sheathing condition.
- Fasteners and waterproofing: correct flashing and sealants preserve roof life.
- Materials: asphalt shingle, metal standing seam, and concrete tile each need specific attachments.
Quality and climate-appropriate equipment matter. The IEA stresses standards and climate suitability for inverters and racking to protect performance and durability (Getting Wind and Solar onto the Grid).
5) Orientation and Tilt
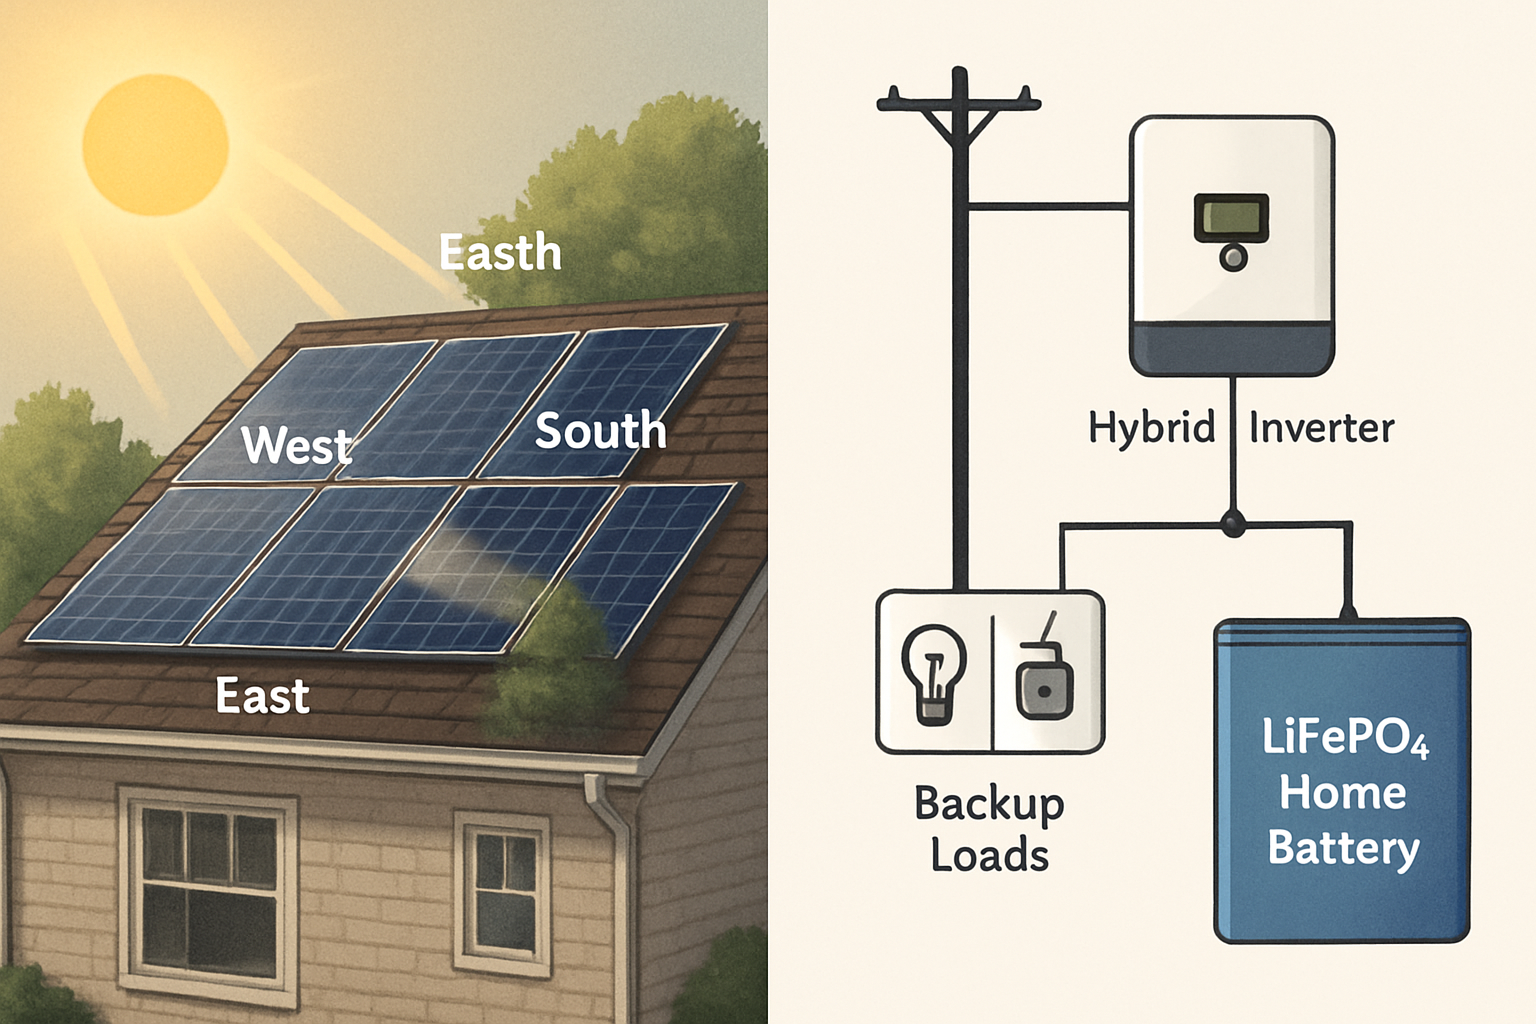
Solar works on many orientations. Tilt angles between ~10–35° cover most roofs. Steeper tilts aid snow shedding in cold climates; low tilts suit flat roofs and hurricane straps. Orientation and tilt shift daily and seasonal output. If your priority is mid‑day yield, a sun-facing plane helps. If you value output spread across morning and late afternoon for time-of-use rates, dual-plane or low-tilt east–west can help match usage. These design choices tune timing more than they determine go/no-go.
The IEA and Energy.gov both signal broad siting feasibility and timing flexibility using modern design tools and tariffs (Energy.gov: Solar Energy, IEA).
6) Electrical Panel Readiness and Interconnection
Check main panel rating, space for breakers, and grounding. A 200 A service makes upgrades easier. Many homes with 100 A can still host PV with right-sizing and interconnection methods.
- Backfeed breaker placement follows code; some panels allow the “120% rule,” while others need a line-side tap or service upgrade.
- Inverter export limiting can keep current within panel limits.
- Plan for future circuits (EV charger, heat pump, battery) to avoid rework.
Standards-based equipment and proper interconnection help maintain safety and reliability—principles underlined in IEA’s discussion on inverter-based resources and standards (Getting Wind and Solar onto the Grid).
7) Energy Use Pattern, Tariff, and Sizing Target
Gather 12 months of kWh. Set a realistic offset target, often 60–100% of annual use depending on roof space, budget, and tariff rules.
- Time-of-Use (TOU): value shifts to late afternoon and evening; PV on multiple planes and/or storage can boost bill savings.
- Flat rates: steady offset; target higher annual kWh from PV if roof allows.
- Demand charges: smart inverter controls and possible storage reduce peak draw.
Design Focus by Tariff Type
| Tariff Type | PV Design Lean | Storage Value Add |
|---|---|---|
| TOU with high evening prices | Dual-plane or slightly west-biased arrays | High: shift mid‑day PV to peaks |
| Flat volumetric rate | Max annual yield; simple south or dual-plane | Moderate: backup + limited bill shaping |
| Demand charge + TOU | Smoothed output; inverter controls | High: clip peaks and arbitrage |
Large-scale assessments show PV plus storage reshapes net load and reduces curtailment, improving system value—findings captured in U.S. Solar Futures analyses summarized by Energy.gov and context from IEA. IRENA also tracks storage-cost trends that affect home ROI (IRENA).
8) Local Rules, Incentives, HOA, and Grid Context
Permits, inspections, interconnection queues, and HOA aesthetic rules shape timelines. Incentives and export credit policies shape sizing decisions. Secure program details early to prevent change orders.
- Permitting: ask about structural letter needs, fire setbacks, and plan review times.
- Incentives: check tax credits, rebates, and any performance-based programs.
- Export rules: net metering, net billing, or buy-all/sell-all affect array size and battery value.
Energy policy and grid operations evolve. EIA’s public datasets track electricity trends relevant to retail tariffs and adoption (EIA). For equipment quality and standards that aid smooth interconnection, see the IEA’s guidance (Getting Wind and Solar onto the Grid).
Disclaimer: Policy, tax, and HOA topics involve legal and financial interpretations. This is not legal or tax advice. Consult a qualified professional.
9) Future Plans and Resilience
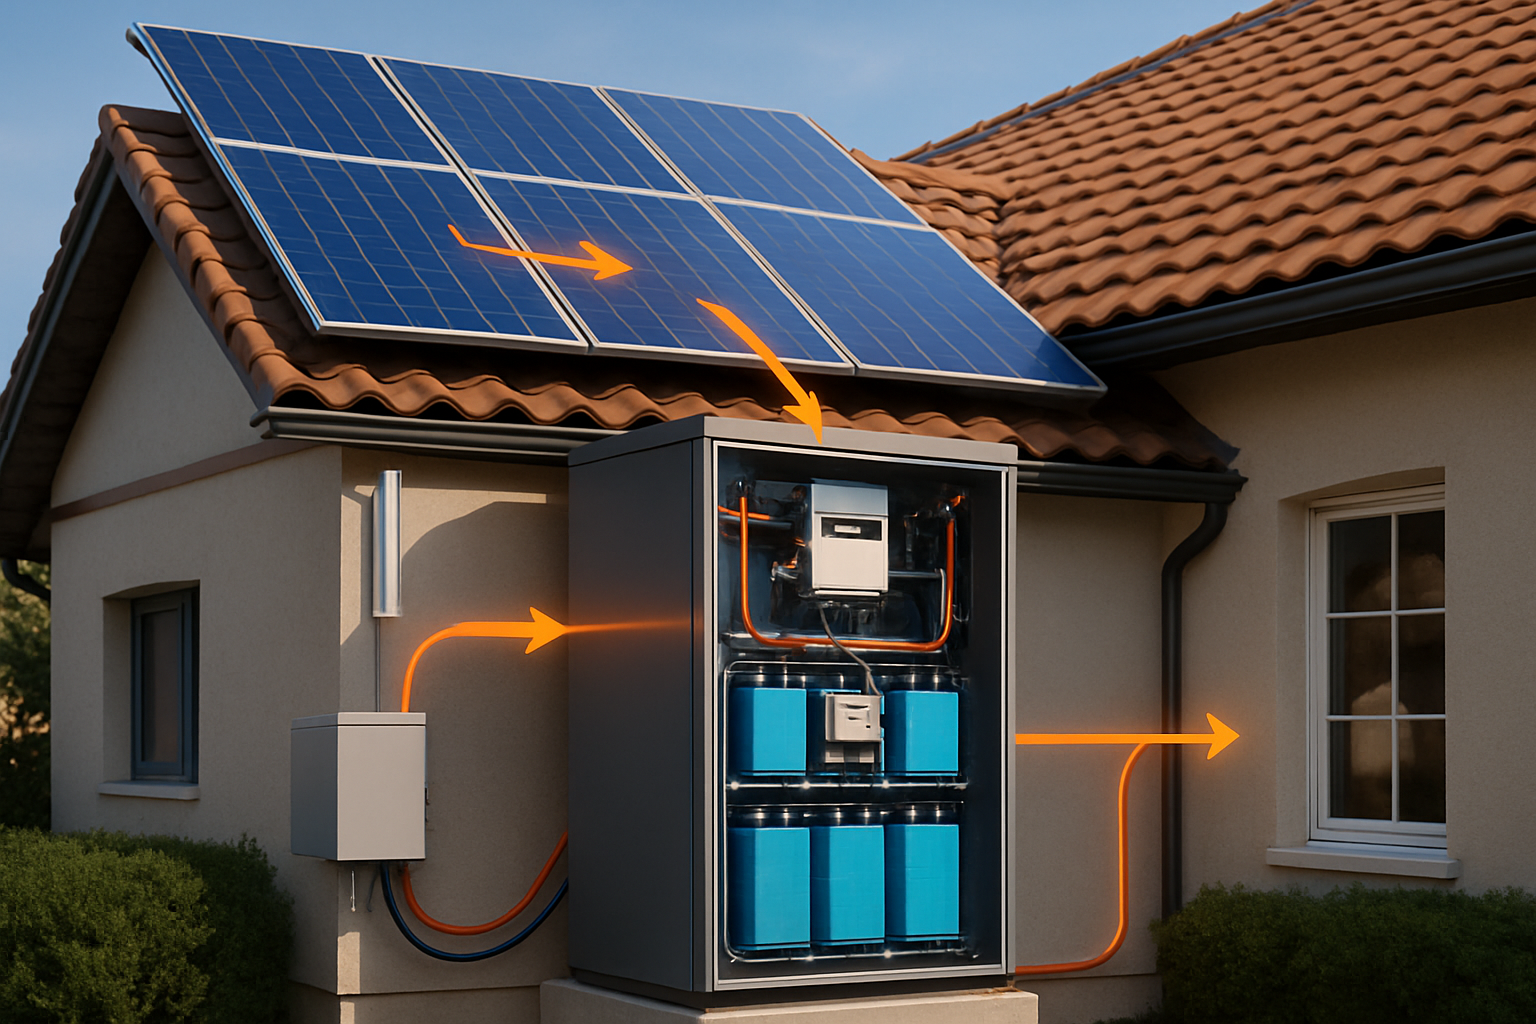
Think two steps ahead. EV charging, heat pumps, or a future home office can add 2,000–5,000+ kWh per year. Leave roof space, conduit, and panel capacity for upgrades. If backup is a priority, choose a hybrid inverter with transfer capability and plan a LiFePO4 battery cabinet rated for indoor installation with clear thermal and fire-safety specs.
Public studies show that pairing PV with storage increases on-site use and supports reliability by shaping net load peaks. Storage also shortens outage recovery and boosts resilience, themes covered in Energy.gov summaries and system-level modeling from the IEA (Energy.gov: Solar Energy, IEA, IRENA).
Quick Homeowner Actions That Make a Big Difference
- Capture roof photos at 9 a.m., noon, and 3 p.m. from the yard to spot shading.
- Measure longest clear roof run and height to estimate module rows.
- Pull your last 12 utility bills. Note TOU periods and demand charges.
- Open the main panel door. Photograph the label (amperage) and breaker layout.
- List near-term upgrades: EV, heat pump, or remodel plans.
Realistic Expectations, Backed by Public Data
Independent agencies point to strong rooftop potential and steady technology gains. The IEA documents long-term efficiency improvements and cost declines in PV manufacturing pathways (Solar Energy Perspectives). EIA tracks grid emissions and electricity trends that frame retail rate design (EIA). Energy.gov highlights standards, safety, and consumer basics that make residential PV practical today (Energy.gov: Solar Energy). IRENA surveys global deployment and storage cost trajectories that influence project economics (IRENA).
Putting It All Together
A home is a strong candidate for solar if: roof planes offer 28–35 m² of usable area for each 6 kW you aim to install; annual shade losses stay around or under 10–15%; the structure can support 2–4 psf additional load; the electrical panel can host a backfeed or a plan exists to upgrade or limit export; and your tariff and usage pattern support steady bill savings—further improved with a right-sized LiFePO4 storage system for evening and outage needs. PV’s modular nature and maturing standards make it fit many homes, not just a narrow set. That is consistent with themes in Solar Energy Perspectives and Getting Wind and Solar onto the Grid.
Financial note: Savings and payback vary with tariffs, incentives, and site specifics. This is general information, not financial advice.


Leave a comment
All comments are moderated before being published.
This site is protected by hCaptcha and the hCaptcha Privacy Policy and Terms of Service apply.