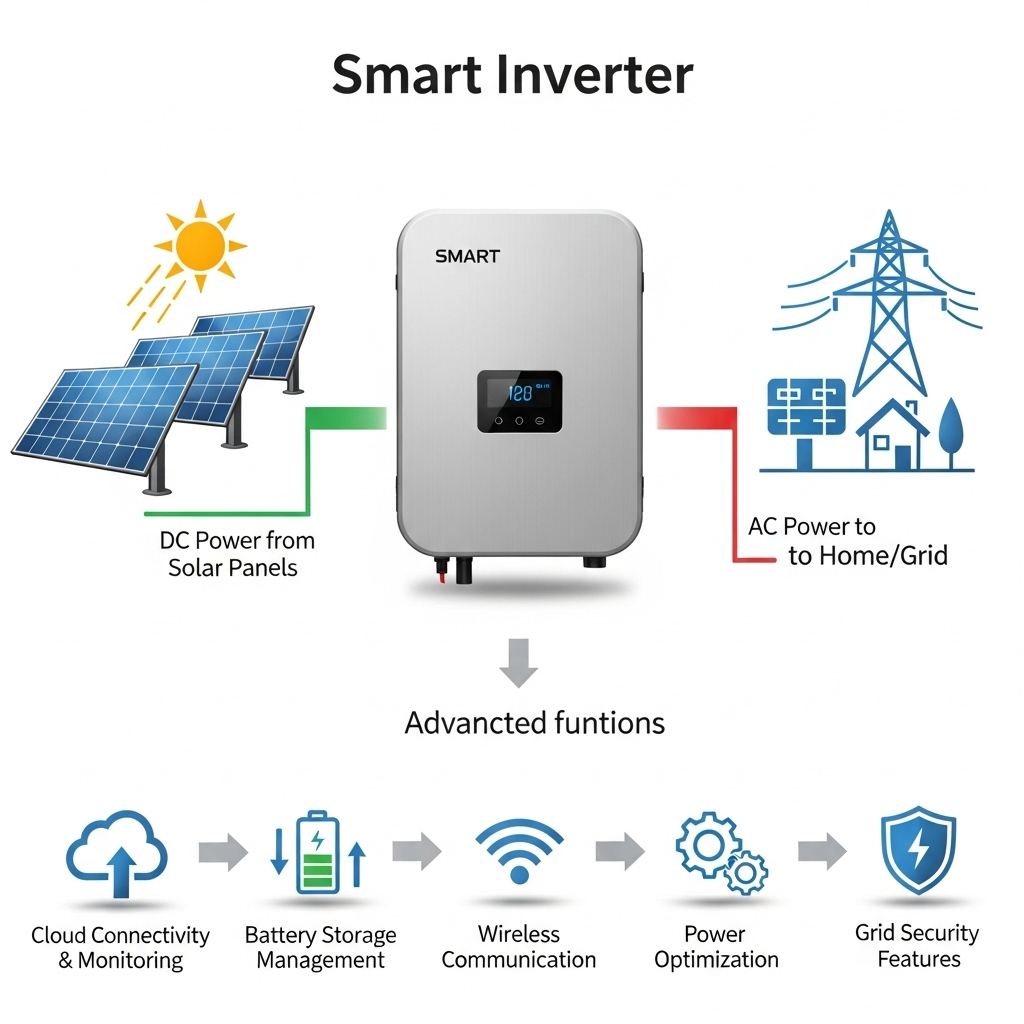
From working on utility-scale bids and distributed projects, I’ve learned that targets don’t lower costs by themselves—they catalyze the market forces that do. Ambitious goals create demand certainty, but prices fall only when manufacturing scales, financing improves, permitting gets simpler, and technology matures. Here is how I connect high-level targets to real, bankable cost reductions you can plan around.
The Direct Link: How Targets Stimulate the Market
Creating Demand and Scaling Production
Clear targets and supportive packages (e.g., IRA in the U.S., REPowerEU in the EU) de-risk demand and pull forward factory investment. The IEA’s World Energy Investment shows how policy momentum boosts low-emission power buildout—scale then drives learning curves and lower unit costs.
Fostering a Competitive Landscape
Once demand is credible, more manufacturers and EPCs compete. I’ve watched bids tighten as firms streamline supply chains and push efficiency. Competition transmits technology gains to end-users instead of letting cost savings stall upstream.
Driving “Learning Investments”
Early incentives are better viewed as learning capital: deployments yield field data on reliability, installation time, and O&M. DOE’s SunShot program framed this explicitly—targeting cost competitiveness via accelerated deployment and R&D, not subsidies alone. See DOE’s overview of the pathway On the Path to SunShot.
The Indirect Effects: Beyond Simple Supply and Demand
Spurring Technological Innovation
Targets unlock R&D budgets and pilot lines. In practice, I’ve seen module efficiency, inverter controls, and BOS standardization improve fastest where targets are paired with grants or testbeds—shortening the lab-to-field cycle.
The Challenge of “Soft Costs”
Hardware fell rapidly, but soft costs—permitting, interconnection, labor, customer acquisition—remain stubborn and local. NREL’s tracking of installed system costs shows these non-hardware items vary by market segment and region, and are now a major frontier for savings. See NREL Installed System Cost Analysis.
Supply Chain Dynamics
Concentrated PV supply chains create vulnerability: trade actions, logistics, or shocks in one region can ripple into global prices and schedules. The IEA’s Solar PV Global Supply Chains details concentration risks across polysilicon, wafers, cells, and modules. Targets help scale, but resilience requires diversified manufacturing and materials strategies.
A Look at the Data: What Actually Moves the Numbers?
LCOE, Financing, and Macro Conditions
LCOE depends not just on hardware but also on the cost of capital. IEA illustrates that lowering WACC can reduce LCOE materially for the same asset—a reminder that policy which improves financing conditions can cut costs even without new hardware gains. See IEA’s discussion of LCOE sensitivity to WACC here.
| Driver | Effect on Cost | Practical Lever |
|---|---|---|
| Manufacturing scale | Learning curve; lower $/W | Stable demand via targets and auctions |
| Financing (WACC) | LCOE sensitivity is high | Credit support, long-tenor PPAs |
| Soft costs | Local, can exceed hardware share | One-stop permits, digital interconnection |
| Supply resilience | Volatility & delays if concentrated | Diversified supply, local content |
Note: Table summarizes relationships supported by IEA/DOE/NREL analyses.
The Crucial Role of Storage and Flexibility
As penetration rises, variability costs matter. In projects I’ve supported, adding batteries converted curtailment and ramp constraints into monetizable services (peak shaving, shifting, reserves). Policy that values flexibility makes the “target → real savings” link much stronger by reducing system-level integration costs.
From Broad Targets to Bankable Plans: My Checklist
- Ground truth soft costs: Validate permit, labor, interconnection timelines against NREL benchmarks; assume variance by jurisdiction.
- Model WACC explicitly: Tie LCOE cases to realistic financing; cite current market data when presenting to ICs and lenders.
- Stress-test supply: Map single-source risks; hold schedule and price contingencies aligned with IEA supply-chain insights.
- Plan for flexibility: Evaluate storage or demand-side options where curtailment or ramp limits are likely; cost the avoided curtailment.
References
- IEA — World Energy Investment 2023
- DOE — On the Path to SunShot
- NREL — Installed System Cost Analysis
- IEA — Solar PV Global Supply Chains
- IEA — LCOE & cost of capital discussion
Disclaimer: This article reflects project-level experience and cited research. It is for educational purposes, not financial advice. Validate with current local data and regulations before investing.


Leave a comment
All comments are moderated before being published.
This site is protected by hCaptcha and the hCaptcha Privacy Policy and Terms of Service apply.