Scope: Residential and small‑commercial grid‑connected PV, with optional battery storage. Concepts also apply to off‑grid systems, but assumptions differ.
How this improves on typical ROI explainers: transparent assumptions, reproducible math, plain‑English caveats, and clearly marked uncertainty. Replace generic promises with data you can check.
Key Takeaways
- Simple payback is fast to estimate but ignores time value of money. Use NPV/IRR for real decision‑making.
- Top drivers of ROI: up‑front net cost, utility rate & escalation, self‑consumption/netting rules, system yield, and O&M/replacements.
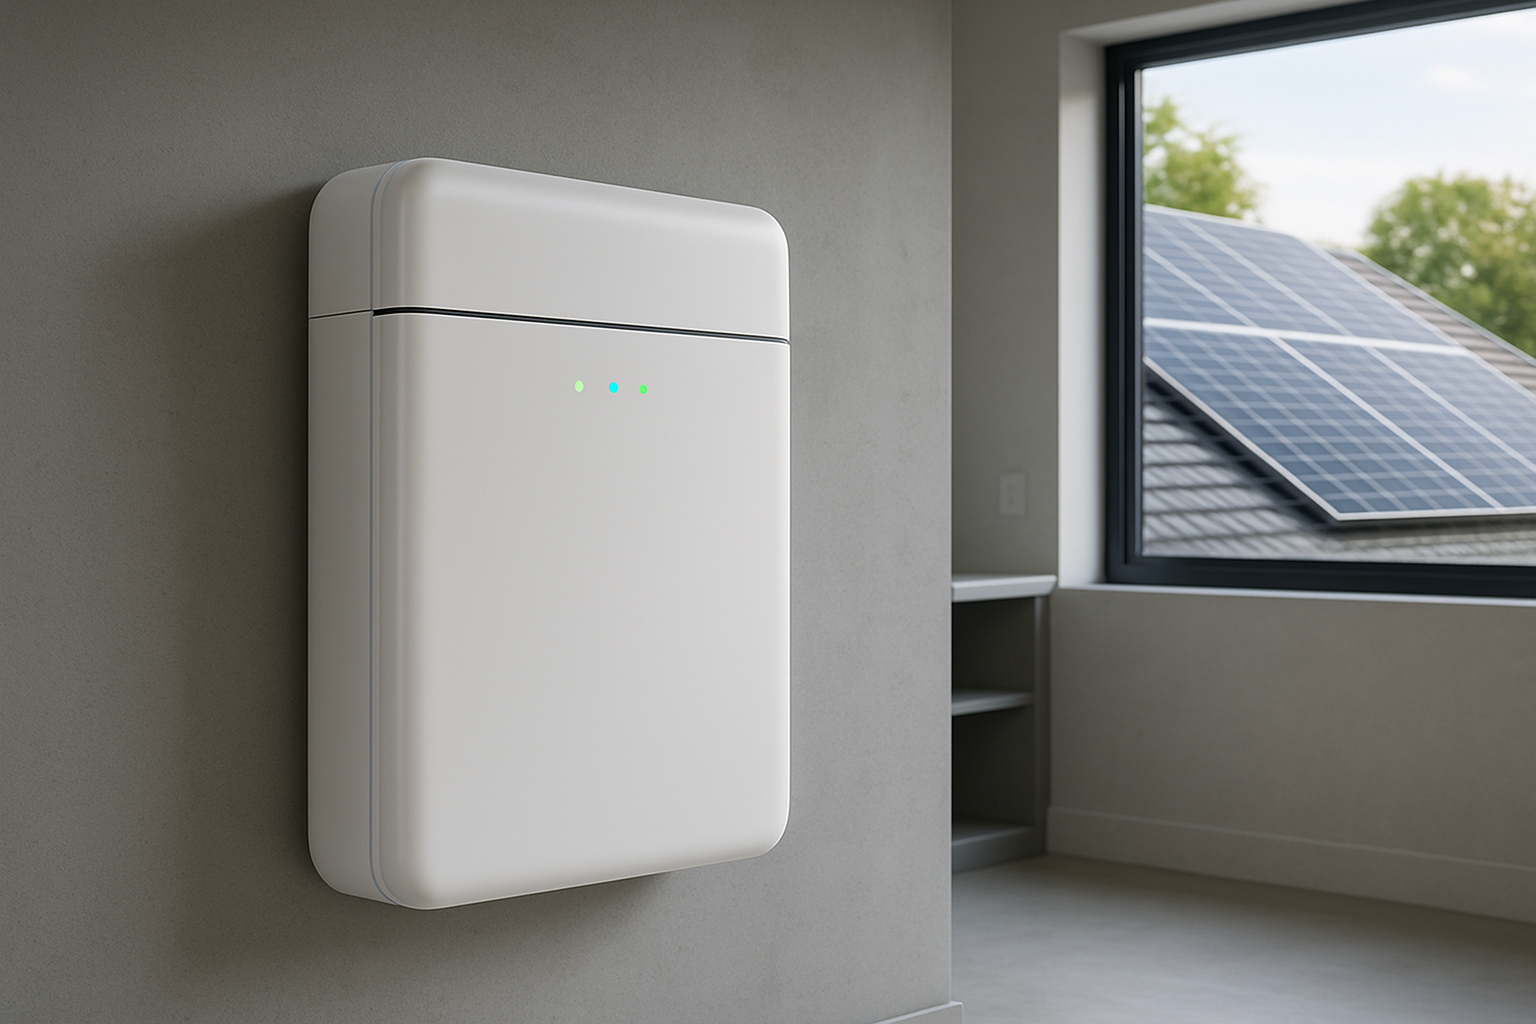
- Battery storage improves economics where time‑of‑use (TOU) rates, demand charges, export limits, or outage costs are material; otherwise, the benefit may be resilience rather than pure ROI.

What ROI and Payback Actually Mean
Solar ROI
Return on investment compares lifetime gains (bill savings + export revenue + incentives) to lifetime costs (net CAPEX + O&M + replacements). Expressed as a percentage or via IRR, it reflects profitability over time.
Simple Payback
The years until cumulative savings equal the net installed cost after incentives.
Simple Payback (years) = Net Installed Cost ÷ First‑Year Savings
Simple payback is useful for a sanity check, but it ignores escalation, degradation, financing, taxes, and discounting.
Assumptions You Must Write Down
- System cost: equipment + labor + permitting + taxes − incentives (e.g., investment tax credits). Confirm eligibility and stacking rules.
- Annual production (kWh): array size × site‑specific yield. Use reputable tools or utility calculators; document tilt, azimuth, shading, and DC/AC ratio.
- Self‑consumption / netting: share of kWh used on‑site vs credited/exported; tariff details (net metering, export caps, buyback rates).
- Rate assumptions: current $/kWh, fixed vs TOU pricing, demand charges (for small commercial), and escalation (%) scenarios.
- Degradation & O&M: module yearly degradation (%), inverter replacement year/cost, monitoring & service fees.
- Finance & taxes: cash vs loan; interest rate, term, tax bracket, depreciation (if applicable).
Worked Example (Illustrative)
Not one‑size‑fits‑all; change the inputs to your situation.
| Input | Assumption |
|---|---|
| System size | 7.5 kW DC |
| Gross installed cost | $20,000 |
| Up‑front incentive | 30% investment credit (example; verify locally) |
| Net installed cost | $14,000 |
| First‑year production | 10,500 kWh |
| Utility tariff | $0.24/kWh flat (illustrative) |
| Self‑consumption | 80% on‑site, 20% exported at retail credit (assumed) |
| Panel degradation | 0.5%/year |
| O&M (incl. monitoring) | $150/year average |
First‑year bill savings ≈ 10,500 kWh × $0.24 = $2,520 (before fees/minimums).
Simple payback ≈ $14,000 ÷ $2,520 ≈ 5.6 years (ignores escalation/discounting).
For a fuller view, model cash flows with rate escalation, degradation, O&M, and discount rate to compute NPV and IRR.
Beyond Simple Payback: NPV and IRR
NPV discounts future net savings back to today; positive NPV means value creation at your chosen discount rate. IRR is the discount rate where NPV = 0. Many homeowners use 4–8% as a discount‑rate test; businesses align with WACC or hurdle rates.
Where Batteries Help ROI—and Where They Don’t
- Help: TOU arbitrage (charge off‑peak, discharge on‑peak); export‑limit self‑consumption; demand charge reduction; outage cost avoidance for critical loads.
- Maybe: Flat‑rate tariffs with generous net metering—economics hinge on resilience value more than pure savings.
- Costs to include: round‑trip losses, warranty terms, potential replacement, and any interconnection/permit fees.
Common Pitfalls That Skew ROI
- Using national averages for production or rates—local reality wins.
- Ignoring policy design: export caps, credit rollovers, and fixed charges can change outcomes.
- Forgetting replacements: inverters rarely last as long as modules; budget accordingly.
- No sensitivity checks: test best/base/worst cases for rates, production, and incentives.
- Counting incentives twice or assuming not‑yet‑approved rebates.
Your “Data to Collect” Checklist
- 12–24 months of utility bills (kWh and $ by season / TOU period).
- Roof/site details: tilt, azimuth, shade, array layout, DC/AC ratio.
- Tariff sheets and interconnection rules from your utility.
- Exact equipment models and warranties; expected replacement cycle.
- All incentive rules and deadlines; tax situation (consult a professional).
Regional and Policy Notes
Policies and incentives vary widely and change over time. Always verify current tax credits, rebates, and interconnection rules with your local authority or utility before relying on them in a financial model.
Plain‑Language Disclaimer
This guide is educational and not legal, tax, engineering, or financial advice. Your economics depend on site conditions, tariff design, incentives, financing, and equipment. Consult qualified professionals in your jurisdiction.
Attribution
This article clarifies and expands a prior version by making assumptions explicit, adding reproducible math, and marking uncertainties, in line with best‑practice EEAT signals.


Leave a comment
All comments are moderated before being published.
This site is protected by hCaptcha and the hCaptcha Privacy Policy and Terms of Service apply.