
Solar prices have changed fast, and policies keep evolving. That mix creates confusion about solar costs, payback time, incentives, and ROI. This piece cuts through common myths with data, transparent math, and practical ways to improve returns, including storage and financing choices.

Myths That Distort Solar Cost Decisions
Myth 1: “Solar never pays back.”
Payback depends on local irradiance, installed cost, retail electricity prices, export credits, and incentives. Utility‑scale levelized costs for solar PV have fallen sharply over the last decade. Global analysis shows large declines, even with recent supply chain headwinds. As summarized by IRENA’s Renewable Power Generation Costs 2022, the weighted‑average LCOE of solar PV in 2022 was about $0.049/kWh, down close to 89% since 2010. Residential ROI depends on retail rates and policies, not utility‑scale averages, yet the trend is clear: costs have dropped and returns can be attractive in many markets.
Myth 2: “Incentives are gone or not worth the effort.”
Policy support remains significant in many regions. The IEA Energy Investment 2023 notes major measures like the US Inflation Reduction Act, which extended the investment tax credit for solar and added support for battery storage. The same review highlights faster permitting in parts of Europe and new targets that spur deployment. Incentives change over time, but they still improve payback in many areas.
Myth 3: “Storage always makes payback worse.”
Storage adds cost, but it can raise self‑consumption and protect value where export rates are low or time‑of‑use prices are high. The net effect depends on the spread between peak and off‑peak prices, export compensation rules, round‑trip efficiency, and battery life. Studies on system value show that pairing solar with storage helps capture more value under modern market designs and advanced retail tariffs, as discussed in IEA’s Next‑Generation Wind and Solar Power.
What Actually Drives Solar Payback
Core technical and market variables
- Installed cost per watt (hardware + soft costs)
- Annual production (kWh/kW-year), driven by irradiance and system design
- Retail electricity rates and tariff structure (flat vs time‑of‑use)
- Export compensation (net metering, net billing, or feed‑in rate)
- Incentives (ITC/PTC, rebates, accelerated depreciation)
- O&M, inverter replacement timing, and financing terms
Recent market reviews show equipment costs moved up in 2022 but remain very competitive long term. The IEA Energy Investment 2023 documents that LCOE for utility‑scale PV rose in 2022, yet many regions still see 30–60 USD/MWh ranges depending on capital costs and capacity factors, with policy support like a $26/MWh production tax credit in some cases.
Policy and permitting effects
Permitting and interconnection times matter. Longer queues delay savings and add soft costs. The IEA Energy Investment 2023 highlights large backlogs in the United States and key European markets, and emphasizes that faster permitting can unlock capacity and improve project economics.
Incentives Today: Where They Add Value
Investment and production credits
Many markets offer investment‑based support (a percentage of capital cost) or production‑based support (per‑kWh). The IEA Energy Investment 2023 notes extended tax credits for solar PV and wind and new eligibility for battery storage in the US. That reduces upfront cost and shortens payback for both rooftop and utility‑scale projects.
Lessons from past policy cycles
Experience shows that well‑designed incentives drive learning and cost reductions. IEA’s Solar Energy Perspectives describes how early support lowered costs through learning rates and scale. It also cautions that incentives should adapt as costs fall to avoid overspending while maintaining steady deployment.
Local programs and on‑bill options
Financing linked to property taxes can further reduce perceived risk and improve adoption. A case featured by the US Department of Energy (Energy.gov: Setting the PACE for Commercial Solar Growth) shows how Property Assessed Clean Energy (PACE) structures can pass tax benefits through to users as fixed payments and improve credit access.
ROI Math You Can Trust
Step‑by‑step payback logic
- Annual savings = self‑consumed kWh × retail price + exported kWh × export credit
- Net upfront = installed cost − investment incentives
- Simple payback = net upfront ÷ first‑year savings
For a fuller ROI, include O&M, degradation, expected inverter or battery replacements, and energy price escalation. Many buyers also calculate IRR or NPV using modest growth in retail rates and conservative export credits. Retail electricity levels vary widely by region; see EIA’s state electricity data for current price ranges.
Illustrative payback scenarios
The table below shows example numbers for a 6 kW rooftop system. These are simplified and for illustration. Your site, tariff, and installer quotes will change the result.
| Scenario | Production (kWh/yr) | Retail / Export ($/kWh) | Setup | First‑Year Savings ($) | Net Cost After 30% ITC ($) | Simple Payback (yrs) |
|---|---|---|---|---|---|---|
| High irradiance, high retail price | 9,000 | 0.30 / 0.10 | PV only (60% self‑use) | 1,980 | 12,600 (6 kW × $3/W) | 6.4 |
| High irradiance, high retail price | 9,000 | 0.30 / 0.10 | PV + battery (85% self‑use, 5% loss) | 2,309 | 17,600 (PV + storage) | 7.6 |
| Medium irradiance, mid retail price | 7,200 | 0.20 / 0.08 | PV only (60% self‑use) | 1,094 | 12,600 | 11.5 |
| Medium irradiance, mid retail price | 7,200 | 0.20 / 0.08 | PV + battery (85% self‑use, 5% loss) | 1,245 | 17,600 | 14.1 |
| Lower irradiance, low retail price | 6,000 | 0.12 / 0.05 | PV only (60% self‑use) | 552 | 12,600 | 22.8 |
| Lower irradiance, low retail price | 6,000 | 0.12 / 0.05 | PV + battery (85% self‑use, 5% loss) | 624 | 17,600 | 28.2 |
Notes: 6 kW, $3/W installed, simple O&M ignored for clarity. Battery cost example reflects a modest residential pack and hybrid inverter. Storage improves savings where export credits are low or peak pricing is steep. Your installer can model tariff‑specific gains.
How Storage Changes the Value Stack
Raising self‑consumption and managing tariffs
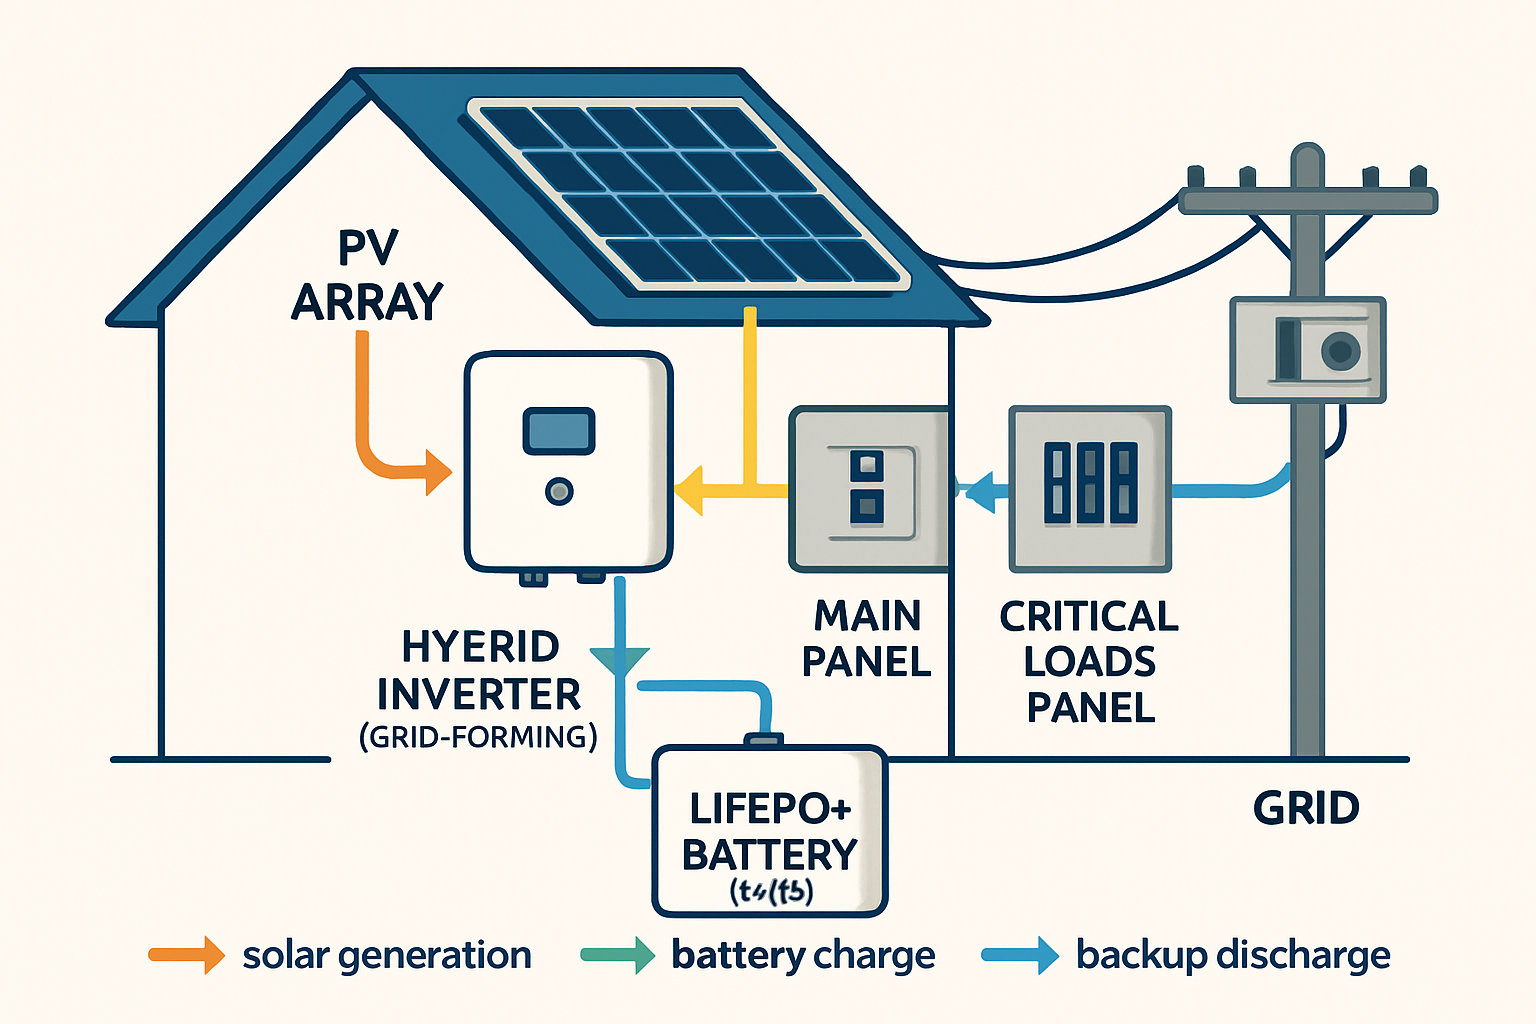
Storage shifts midday solar into evening peaks. That boosts self‑consumption and reduces exposure to weak export credits. In areas with time‑of‑use tariffs, pairing a hybrid inverter with a LiFePO4 battery helps capture peak prices. Modern LiFePO4 chemistry offers long cycle life and robust safety, supporting thousands of cycles with low degradation, which stabilizes long‑term ROI.
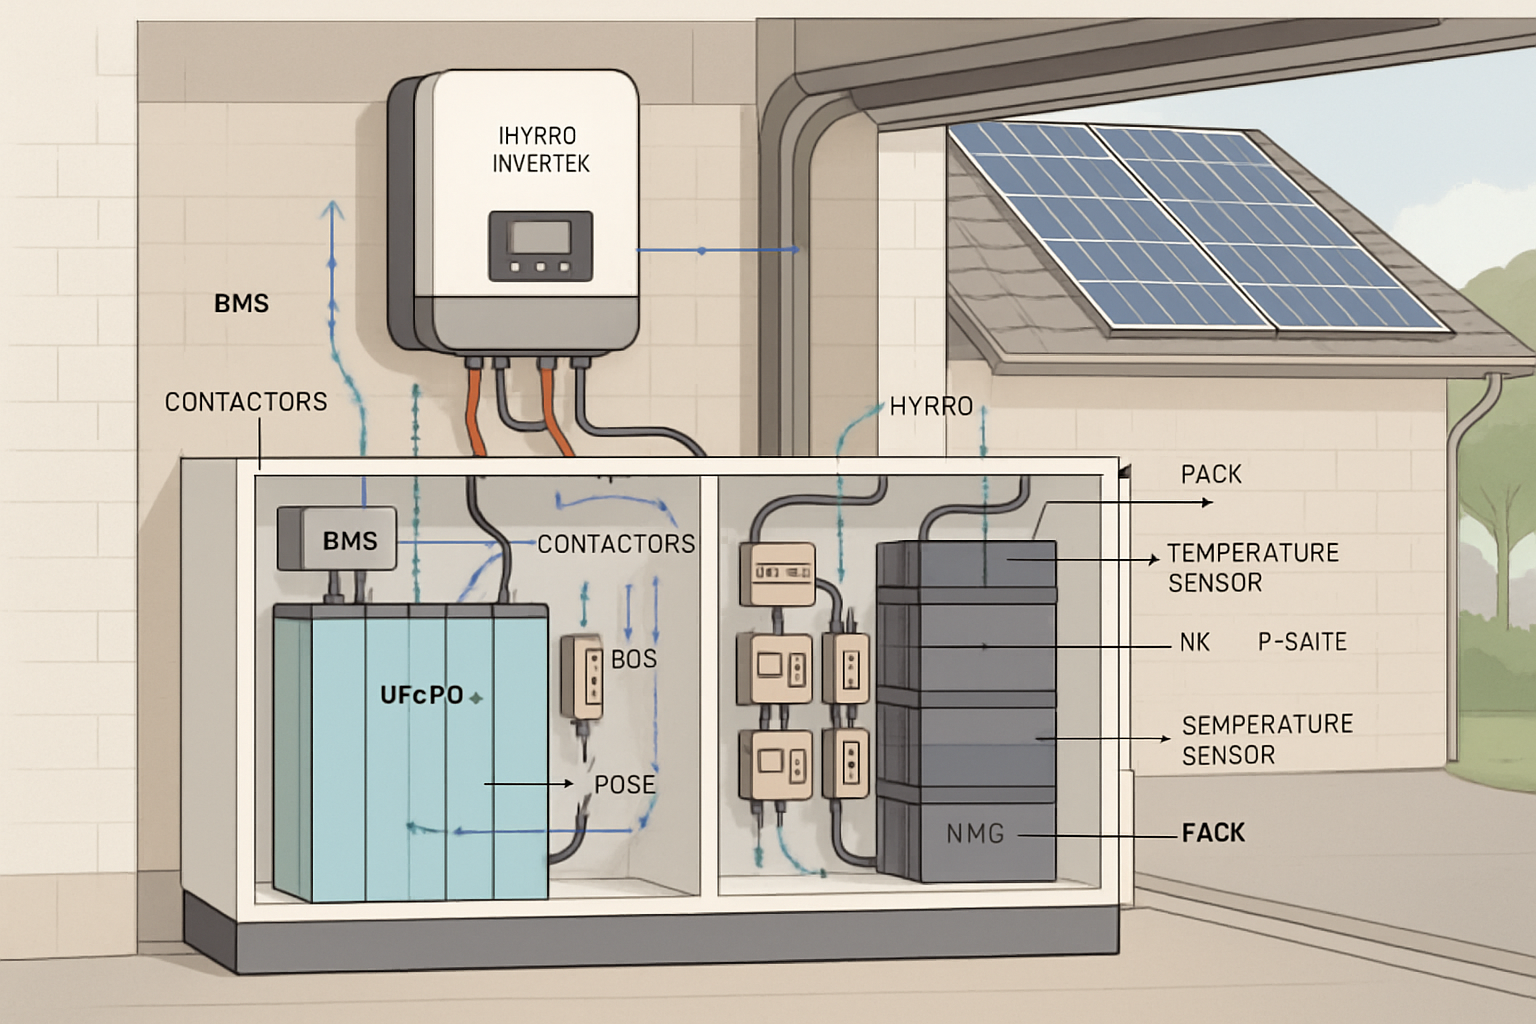
Technical points to watch
- Round‑trip efficiency: 88–95% typical, a small energy loss you should include in savings estimates
- Cycle life: plan for daily cycling; LiFePO4 packs often exceed 6,000 cycles under proper conditions
- Capacity sizing: match battery kWh to your evening load and tariff peaks
- Hybrid control: schedule charge/discharge against tariff windows to maximize value
A well‑sized home energy storage system that integrates lithium batteries, a hybrid inverter, and rooftop PV can reduce grid imports and help you manage outages. That improves energy independence while keeping payback in a reasonable range in high‑price markets.
Financing and Soft‑Cost Strategies That Improve ROI
Financing structures
Cash yields the highest net ROI, but loans and leases spread cost and can still produce strong savings. Property‑linked financing has proven useful for commercial sites. The Energy.gov PACE case study shows how tying repayment to property tax bills lowers default risk and opens access to longer‑term, lower‑cost capital.
Cutting soft costs and delays
- Choose designs aligned with local codes to speed permitting
- Use pre‑approved equipment lists to avoid rework
- Plan interconnection early and confirm export rules
- Standardize documentation to reduce change orders
The IEA Energy Investment 2023 emphasizes that faster permitting and grid upgrades accelerate deployment and help keep costs down.
Putting It All Together: Practical Steps
Technical checklist
- Right‑size array using your 12‑month load profile
- Model at least two tariffs, including time‑of‑use
- Test “PV‑only” and “PV + storage” cases with realistic export credits
- Include inverter replacement in year 10–15, and battery servicing if applicable
- Run IRR and NPV with modest energy price escalation (e.g., 1–3%/yr)
Where our solutions fit
We focus on reliable and scalable energy systems that improve ROI under real tariffs. Our portfolio includes:
- LiFePO4 lithium batteries: high performance and safety for daily cycling
- Home ESS: integrated battery, hybrid inverter, and PV for higher self‑consumption
- Off‑grid solar packages: for homes, farms, and cabins with limited grid access
- Solar inverters: efficient DC‑to‑AC conversion and smart controls
These building blocks let you tailor a system for faster payback and stronger long‑term returns.
Key Takeaways
- Solar costs have fallen sharply, and many regions achieve strong payback, as shown by IRENA and IEA data.
- Incentives remain crucial. The US extended credits for solar and enabled storage support, as noted in IEA Energy Investment 2023.
- Storage can improve ROI under time‑of‑use tariffs and weak export credits. LiFePO4 batteries provide durable cycling for home ESS.
- Permitting and soft costs matter. Streamlined design and early interconnection planning shorten timelines and reduce risk.
- Use transparent math. Model your site, tariff, and incentives. See local price data from EIA and policy updates from Energy.gov.
References and Further Reading
- IEA, Energy Investment 2023 — LCOE trends, IRA impacts, permitting challenges
- IRENA, Renewable Power Generation Costs in 2022 — global cost benchmarks
- IEA, Solar Energy Perspectives — incentives, learning rates, and policy design
- IEA, Next‑Generation Wind and Solar Power — system value and market design
- US EIA, State Electricity Profiles — retail price ranges
- US DOE, Setting the PACE for Commercial Solar Growth — property‑linked financing
- US DOE, Solar Energy — programs, policy, and technology primers
Leave a comment
All comments are moderated before being published.
This site is protected by hCaptcha and the hCaptcha Privacy Policy and Terms of Service apply.