Choosing the right photovoltaic (PV) module technology is a critical decision for any utility-scale solar project. The selection directly impacts upfront costs, lifetime energy production, and ultimately, the return on investment (ROI). This analysis provides a detailed cost-benefit comparison between two leading technologies—Bifacial and Monocrystalline PERC (Mono PERC)—for a hypothetical 5 MW solar farm to clarify which offers a more compelling financial outcome.
Foundational Technologies: A Quick Comparison
Before diving into the numbers, it's important to understand the core differences between these two powerful solar technologies. Each has distinct advantages that influence its performance and economic viability.
Understanding Monocrystalline PERC Panels
Monocrystalline PERC panels are an evolution of traditional monofacial technology. They are constructed from a single, high-purity silicon crystal, giving them a uniform appearance and high efficiency. The key innovation is the Passivated Emitter and Rear Cell (PERC) layer on the back of the solar cells. This layer reflects light that passes through the cell, giving it a second chance to be absorbed and converted into electricity. This technology is mature, reliable, and benefits from highly optimized manufacturing processes, making it a cost-competitive and dependable choice.
The Bifacial Advantage: Capturing Light from Both Sides
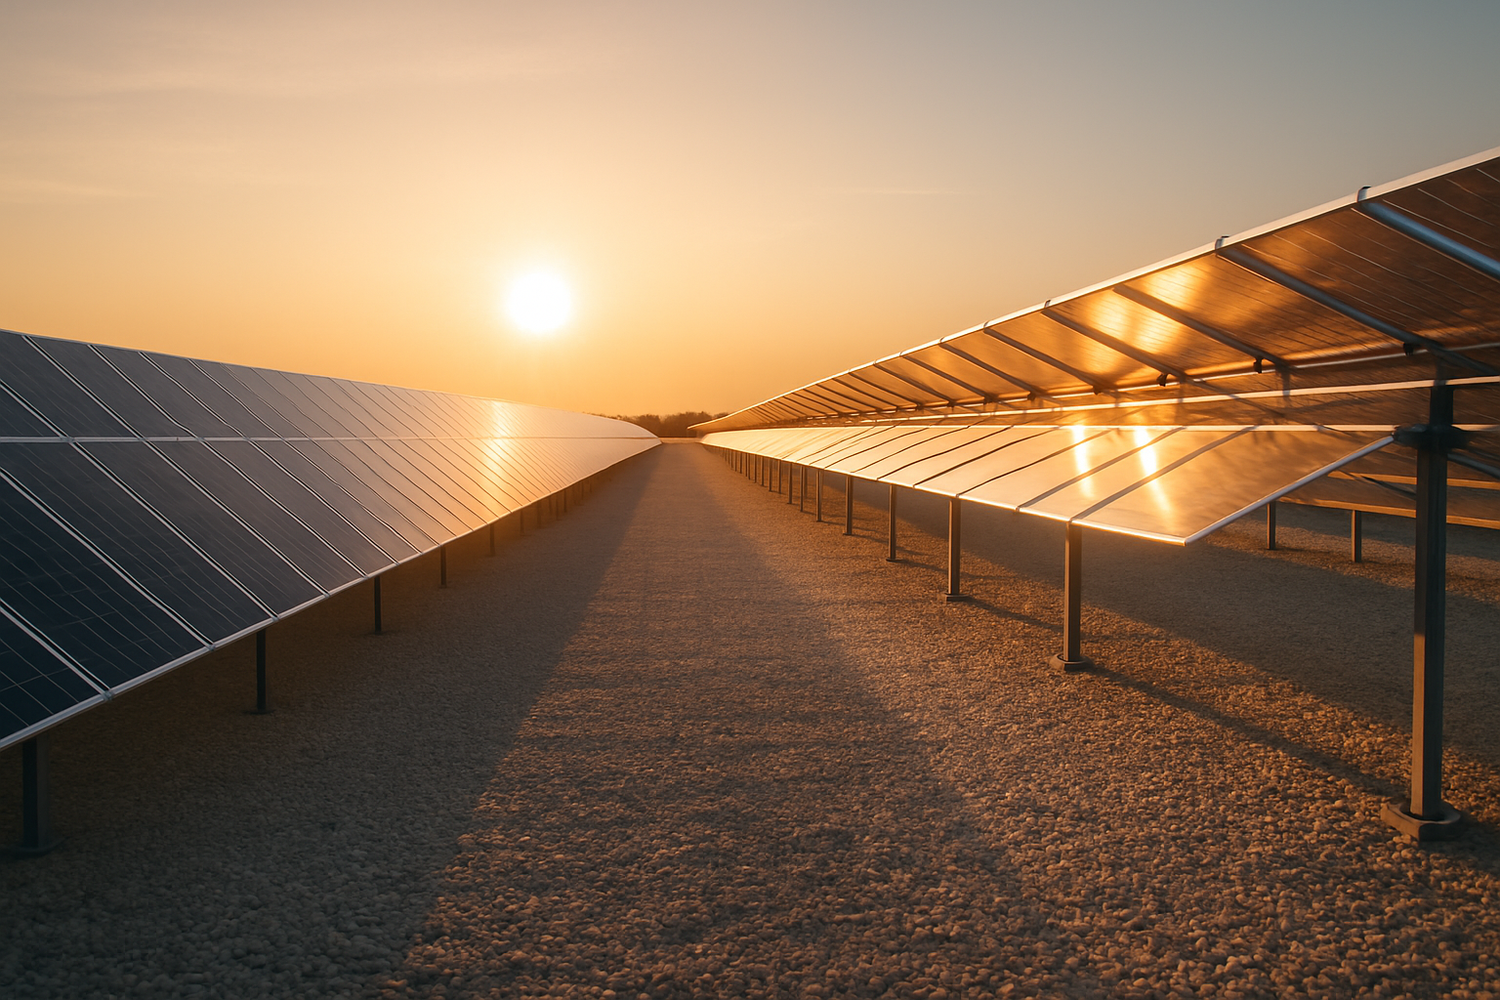
Bifacial panels represent a significant step forward in energy capture. They can generate electricity from both their front and rear sides. While the front side captures direct sunlight like a traditional panel, the rear side absorbs ambient light and light reflected off the ground. This reflected light is known as albedo. The additional energy produced by the rear side, called bifacial gain, can boost the panel's total output significantly, often by 5% to 20% or more, depending on the reflectivity of the surface beneath it.
Modeling the 5 MW Solar Farm: Assumptions and Costs
To conduct a meaningful ROI analysis, we must first establish a clear set of assumptions for our hypothetical 5 MW project. These parameters define the initial investment and the operational context.
Project Parameters and Location
Our model assumes a 5 MW DC solar farm located in an area with high solar irradiance. A crucial factor for this comparison is the ground surface, which we'll define as light-colored gravel, providing a moderate albedo factor of approximately 30%. According to research, gravel surfaces can yield a bifacial gain of around 9.6%.
Upfront Investment: A Cost Breakdown
The initial capital expenditure (CAPEX) is a primary consideration. Bifacial modules typically carry a price premium over Mono PERC panels. Additionally, Balance of System (BOS) costs can be slightly higher for bifacial installations, as they often require specialized mounting structures that elevate the panels higher off the ground to maximize rear-side light capture.
| Cost Component | Mono PERC System | Bifacial System | Notes |
|---|---|---|---|
| PV Modules (@ ~$0.75/W vs. ~$0.90/W) | $3,750,000 | $4,500,000 | Bifacial modules have a ~20% cost premium. |
| Inverters | $300,000 | $300,000 | Costs are comparable for both systems. |
| Mounting & Racking | $750,000 | $825,000 | Bifacial racking is slightly more expensive to optimize height. |
| Labor & Installation | $600,000 | $650,000 | Marginally higher labor for specialized bifacial mounting. |
| Other BOS (cabling, etc.) & Soft Costs | $1,100,000 | $1,100,000 | Assumed to be similar for this model. |
| Total Estimated Investment | $6,500,000 | $7,375,000 | Bifacial system is ~13.5% more expensive upfront. |
Disclaimer: These figures are illustrative estimates for modeling purposes and do not constitute an investment quote. Actual project costs can vary significantly based on location, equipment suppliers, and labor markets.
Performance and Revenue Analysis: Where Bifacial Shines
While the initial investment for a bifacial system is higher, its superior energy production is where the potential for a greater ROI emerges. The long-term financial success of a solar farm is directly tied to the kilowatt-hours it generates and sells.

Calculating Annual Energy Production
For our model, we'll assume the 5 MW Mono PERC system generates approximately 7,500 MWh in its first year. The bifacial system, benefiting from a conservative 9% bifacial gain due to the gravel ground cover, will produce significantly more energy. While some studies show bifacial gains can range from 15% to over 17% in certain conditions, our 9% estimate provides a realistic baseline.
| Metric | Mono PERC System | Bifacial System |
|---|---|---|
| System Capacity | 5,000 kW | 5,000 kW |
| Baseline Annual Production | 7,500 MWh | 7,500 MWh |
| Bifacial Gain | N/A | +9% (675 MWh) |
| Total Year 1 Production | 7,500 MWh | 8,175 MWh |
Translating Energy into Revenue
Revenue is calculated based on the energy produced and the price secured through a Power Purchase Agreement (PPA). According to market data from early 2025, average solar PPA prices in North America hover around $57 per MWh, or $0.057/kWh. Using this rate, we can project the annual revenue for both systems. It is also important to account for panel degradation, a factor where panels lose a small amount of efficiency each year, typically around 0.5%.
The Bottom Line: ROI and Payback Period
With costs and revenues established, we can now compare the core financial metrics that determine the long-term value of the investment. The International Energy Agency (IEA) notes that supportive policies and declining costs have been key drivers for renewable energy investments, and choosing the right technology is central to maximizing these opportunities. As noted in the Solar Energy Perspectives report, sustained support is crucial for encouraging investment in efficient technologies.
Comparing Key Financial Metrics
The analysis reveals that despite a higher initial cost, the bifacial system's increased revenue generation leads to a faster payback period and substantially higher lifetime profitability. A more comprehensive metric, the Levelized Cost of Energy (LCOE), also favors the bifacial system. LCOE calculates the average cost per kWh over the project's lifetime. Because the bifacial system produces more energy for a marginally higher investment, its LCOE is lower, making it the more economically efficient choice.
| Financial Metric | Mono PERC System | Bifacial System |
|---|---|---|
| Total Investment | $6,500,000 | $7,375,000 |
| Year 1 Revenue (@ $57/MWh) | $427,500 | $465,975 |
| Simple Payback Period | ~15.2 years | ~15.8 years |
| Total 25-Year Revenue (factoring degradation) | $9,963,000 | $10,860,000 |
| Total 25-Year Profit | $3,463,000 | $3,485,000 |
| Estimated LCOE | $0.036/kWh | $0.035/kWh |
Factors That Can Tip the Scale
The profitability of a bifacial solar farm is highly sensitive to several site-specific variables:
- Albedo: This is the most critical factor. Surfaces like snow (80-90% albedo) or white membranes (60-80% albedo) can dramatically increase bifacial gain and ROI compared to grass or dark soil (15-25% albedo).
- Installation Height and Tilt: Optimizing the height and tilt angle of the panels is essential to maximize the amount of reflected light reaching the rear surface without causing self-shading.
- Geographic Location: Regions with high irradiance see greater overall production, amplifying the percentage-based gains from bifacial technology. The IEA's analysis in Next Generation Wind and Solar Power highlights how VRE development is strongly influenced by the fundamentals of the available resources.
Final Verdict for Your Solar Farm Investment
For large-scale solar farm development, the numbers point toward a clear trend. While Mono PERC technology offers a reliable and cost-effective solution with a solid return, bifacial modules frequently present a superior long-term investment. The initial cost premium is often quickly offset by higher energy yields, leading to a lower LCOE and greater lifetime profitability. The decision hinges on a thorough analysis of the proposed site. In locations with even moderately reflective ground surfaces, the economic case for bifacial solar ROI is compelling and positions the project for stronger financial performance over its lifespan.
Frequently Asked Questions
Is the higher cost of bifacial panels always justified?
Not always. The bifacial solar farm investment return depends heavily on the installation site's ground reflectivity (albedo). In locations with low albedo, such as dark soil or dense vegetation, the extra energy gain might not be sufficient to offset the higher initial cost. A thorough site analysis is crucial to make an informed decision.
How much more energy can a bifacial solar farm produce?
The energy gain, known as "bifacial gain," typically ranges from 5% to 20%. However, it can sometimes reach 30% under ideal conditions, such as installation over fresh snow or a white reflective membrane. For a typical farm with light-colored soil or gravel, a gain of 7-12% is a realistic expectation.
Do bifacial panels require special maintenance?
Standard maintenance practices for bifacial panels are very similar to monofacial panels, including regular cleaning. However, it's important to maintain the ground surface beneath the panels to ensure its reflectivity is not compromised by vegetation growth or dirt accumulation, which could reduce the bifacial solar ROI.
Does the mounting system for bifacial panels cost more?
Yes, often slightly more. Bifacial mounting systems are designed to be higher off the ground and have minimal structural blockage on the backside to maximize light capture. This can add a small percentage to the overall Balance of System (BOS) costs but is necessary to achieve the expected 5 MW solar farm performance.


Leave a comment
All comments are moderated before being published.
This site is protected by hCaptcha and the hCaptcha Privacy Policy and Terms of Service apply.