Cell technology trends shape photovoltaic module performance and project economics. This report brings together current Cell-Type Market Shares and real Module Efficiency data, then translates them into actionable choices for buyers, EPCs, and asset owners. You will see how Solar Cell Technologies evolved from BSF to PERC and toward n‑type designs, what that means for Photovoltaic Module Performance, and how Market Share Analysis signals the next round of gains.

Context: Manufacturing, costs, and the shift to higher efficiency
Global PV manufacturing scaled fast and cut costs along a clear learning curve. Cost reductions track cumulative deployment, as shown in the PV learning chart in Clean Energy Innovation. This cost curve enabled wider use of higher-efficiency cells without large price penalties.
Industry employment also expanded with the supply chain. Jobs tied to polysilicon, wafer, cell, and module manufacturing nearly doubled over the last decade to about 600,000 in 2021, according to Solar PV Global Supply Chains. That same report tracks global cell production, capacity utilization, and technology turnover—useful context for any market share analysis.
On the technology side, process improvements and a pivot to monocrystalline wafers enabled PERC to take the lead. A widely cited roadmap toward higher mass‑production PERC efficiency is presented in A Roadmap Toward 24% Efficient PERC Solar Cells in Industrial Mass Production. Building on this base, n‑type TOPCon, heterojunction (HJT), and back‑contact designs lift conversion further, while early tandem R&D aims even higher.
Cell-Type Market Shares: 2010–2024 snapshot
Market shares vary by source and quarter, yet broad shifts are clear: BSF dominated early 2010s; PERC took over by the late 2010s; n‑type designs are rising since 2021–2022. The table shows reasonable ranges compiled from public datasets and trade tracking.
| Year | BSF (p‑type) | PERC (p‑type) | TOPCon (n‑type) | HJT (n‑type) | Back Contact | Others |
|---|---|---|---|---|---|---|
| 2010 | 90–95% | <1% | <1% | 1–2% | <1% | 3–5% |
| 2016 | 55–60% | 30–35% | <1% | 2–3% | 1–2% | 5–8% |
| 2022 | 5–10% | 70–80% | 8–12% | 5–8% | 1–2% | 2–4% |
| 2024 (est.) | <2–3% | 55–65% | 20–28% | 8–12% | 2–3% | 2–4% |
Notes: Ranges reflect quarterly fluctuations and different research methodologies. Consolidated insights draw on IEA supply chain reporting and industry trackers. Regional share patterns can differ from the global mix.
Module Efficiency and Field Performance by Cell Type
Higher cell efficiency raises module power at the same area, cuts balance‑of‑system (BoS) per watt, and lifts kWh per square meter. Today’s advanced modules reach roughly 22% in field conditions, about 20% higher than standard products deployed 4–5 years ago. That aligns with observed gains reported in Solar PV Global Supply Chains.
| Cell Technology | STC Module Efficiency | Approx. Field Efficiency (NOCT) | Temp. Coeff. (%/°C) | Annual Degradation | Bifaciality |
|---|---|---|---|---|---|
| BSF (p‑type) | 16.0–18.5% | 14.5–16.5% | −0.40 to −0.43 | 0.6–0.8%/yr | 0% |
| PERC (p‑type) | 20.5–21.8% | 18.5–20.0% | −0.34 to −0.37 | 0.4–0.6%/yr | 65–75% |
| TOPCon (n‑type) | 21.5–23.0% | 19.5–21.0% | −0.30 to −0.33 | 0.2–0.4%/yr | 75–85% |
| HJT (n‑type) | 21.0–22.5% | 19.5–21.0% | −0.25 to −0.28 | 0.2–0.3%/yr | 85–95% |
| Back Contact | 21.5–23.5% | 20.0–21.5% | −0.28 to −0.30 | 0.2–0.4%/yr | 0–10% |
| Si‑tandem (pilot) | 24–28% (pilot) | 22–24% (pilot) | −0.20 to −0.30 (early) | TBD | 70–90% (design‑dependent) |
Ranges reflect public data, field reports, and benchmark disclosures. Tandem values refer to early prototypes; the bankable window is not set. Background on future high‑efficiency architectures is outlined in Solar PV Global Supply Chains and on cost/learning trends in Clean Energy Innovation.
From market shares to LCOE: what the numbers imply
BoS leverage of higher efficiency
Raising module efficiency cuts area for the same DC nameplate. On a 100 MWdc utility site using 2.6 m² modules:
- PERC case: 550 W modules (~21.2% STC). Module count ≈ 182,000.
- TOPCon case: 600 W modules (~23% STC). Module count ≈ 167,000.
The 9% efficiency lift trims modules by ~8% and reduces racks, foundations, DC cabling, and labor roughly in the same range, subject to layout and wind/snow loads. Lower BoS per watt is a primary LCOE driver also noted in IRENA cost analyses.
Yield gains beyond nameplate
- Temperature coefficient: moving from −0.36%/°C (PERC) to −0.31%/°C (TOPCon) improves hot‑climate yield by ~0.6–1.2% depending on site temperature profile.
- Bifaciality: typical PERC bifaciality 65–75% vs. 75–85% for TOPCon; at 25% ground albedo and 1.0 m table height, that can add ~1–3% yield for TOPCon at the same DC size.
- Degradation: n‑type’s 0.2–0.4%/yr vs. 0.4–0.6%/yr for PERC adds a few percent more lifetime energy over 25 years.
Combined, a move from PERC to TOPCon can deliver ~3–6% more annual kWh and lower BoS per watt, reinforcing LCOE gains. These effects align with the broader system value themes in U.S. Department of Energy Solar Energy resources.
Bankability and quality signals
Bankability depends on proven reliability, stable supply, and traceable bill of materials. Use independent lab data and field returns. The cost and reliability context from IEA supply chain reporting and price/performance trends from Clean Energy Innovation help anchor decisions. For utility PPAs, pair higher‑efficiency modules with well‑sized storage to shape output; storage cost and roles are discussed across DOE and IEA scenario work.
Practical selection tips for 2024–2026 procurement
- Match technology to climate: HJT and TOPCon shine in hot sites due to better temperature coefficients. Back contact suits space‑constrained sites seeking high power density.
- Target field efficiency, not only STC: Check NOCT data, bifaciality, and low‑irradiance response. Ask for measured bifacial gains from third‑party tests.
- Use lifetime yield, not year‑1 only: Model degradation and light‑induced effects. Request BOM‑specific PAN files and QA records.
- BoS fit matters: Higher efficiency can reduce piles, trackers, and wiring. Validate with site‑specific layout and structural checks.
- Plan for storage: Pairing PV with LiFePO4‑based systems can capture mid‑day surplus and lift capacity value. Align battery sizing with curtailment and PPA shape.
What’s next: shares and efficiency through 2030
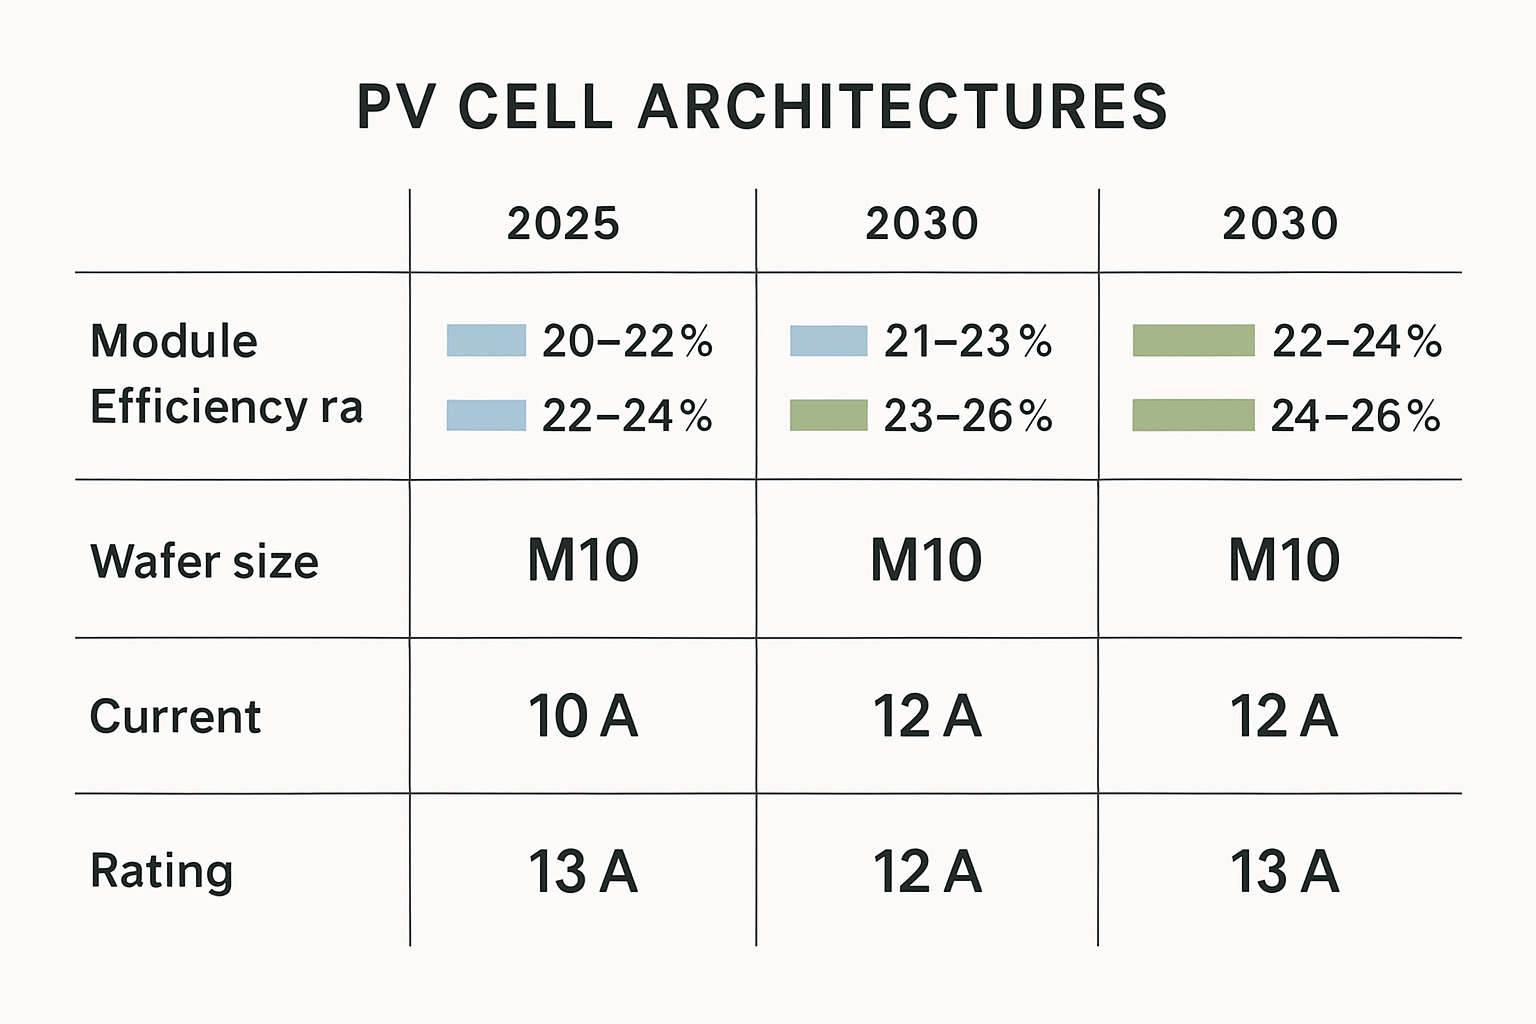
PERC remains a large slice in 2024, yet n‑type is expanding quickly as lines convert. TOPCon’s process continuity helps speed adoption. HJT is growing where ultra‑low temperature coefficients, high bifaciality, and low LID are valued. Tandem silicon‑perovskite R&D targets 30%+ cell efficiency with scalable costs; mass production is still under evaluation. These directions echo the technology pathway signals captured by the IEA supply chain report.
For cost context across the energy stack, see capital and O&M benchmarks referenced by IRENA and energy system statistics from the EIA. They provide independent reference points for ASP and LCOE discussions.
Key sources and further reading
- Solar PV Global Supply Chains — manufacturing, capacity utilization, jobs, and technology shifts.
- Clean Energy Innovation — learning curves and innovation pathways for PV and batteries.
- U.S. Department of Energy Solar Energy — technical resources on PV performance and systems.
- IRENA — global benchmarks on renewable costs and deployment.
- A Roadmap Toward 24% Efficient PERC Solar Cells — mass‑production efficiency roadmap.
Wrapping up
Market share shifts track performance gains. PERC made high efficiency mainstream, and n‑type designs extend that lead with better temperature behavior, higher bifaciality, and slower degradation. For buyers, the payoff shows up twice: fewer modules and BoS per watt, plus more kWh over life. Pair data from independent sources with site‑specific modeling and quality audits, and you will lock in lower LCOE with fewer surprises.
Disclaimer: This report is for informational purposes only and does not constitute investment, procurement, engineering, or legal advice.
FAQ
Which cell type offers the best cost‑to‑performance today?
For many utility sites, TOPCon offers a strong mix of high efficiency, solid bifaciality, and manageable process transitions. HJT also performs well in hot climates but can carry different manufacturing costs. Always compare total project LCOE, not module ASP alone.
Do higher‑efficiency modules always lower LCOE?
Usually, but not automatically. Gains depend on BoS design, site temperature profile, albedo, degradation, and financing. Model multiple layouts and check BoS savings against any premium.
Are tandems ready for large projects?
Tandems show lab‑level efficiency above 30% in cells. Field‑proven module data and long‑term durability at scale are still forming. Check third‑party testing and warranty terms before banked deployment.
How can I validate a manufacturer’s efficiency and bifacial claims?
Request certified STC ratings, PAN files tied to exact BOM, and independent bifacial measurements. Cross‑check with on‑site pilot strings and SCADA logging through at least one seasonal cycle.
What project types benefit most from very high efficiency?
Space‑constrained rooftops, high‑land‑cost sites, or projects seeking to minimize trackers and piles. In these cases, power density delivers outsized BoS and opex savings.


Leave a comment
All comments are moderated before being published.
This site is protected by hCaptcha and the hCaptcha Privacy Policy and Terms of Service apply.