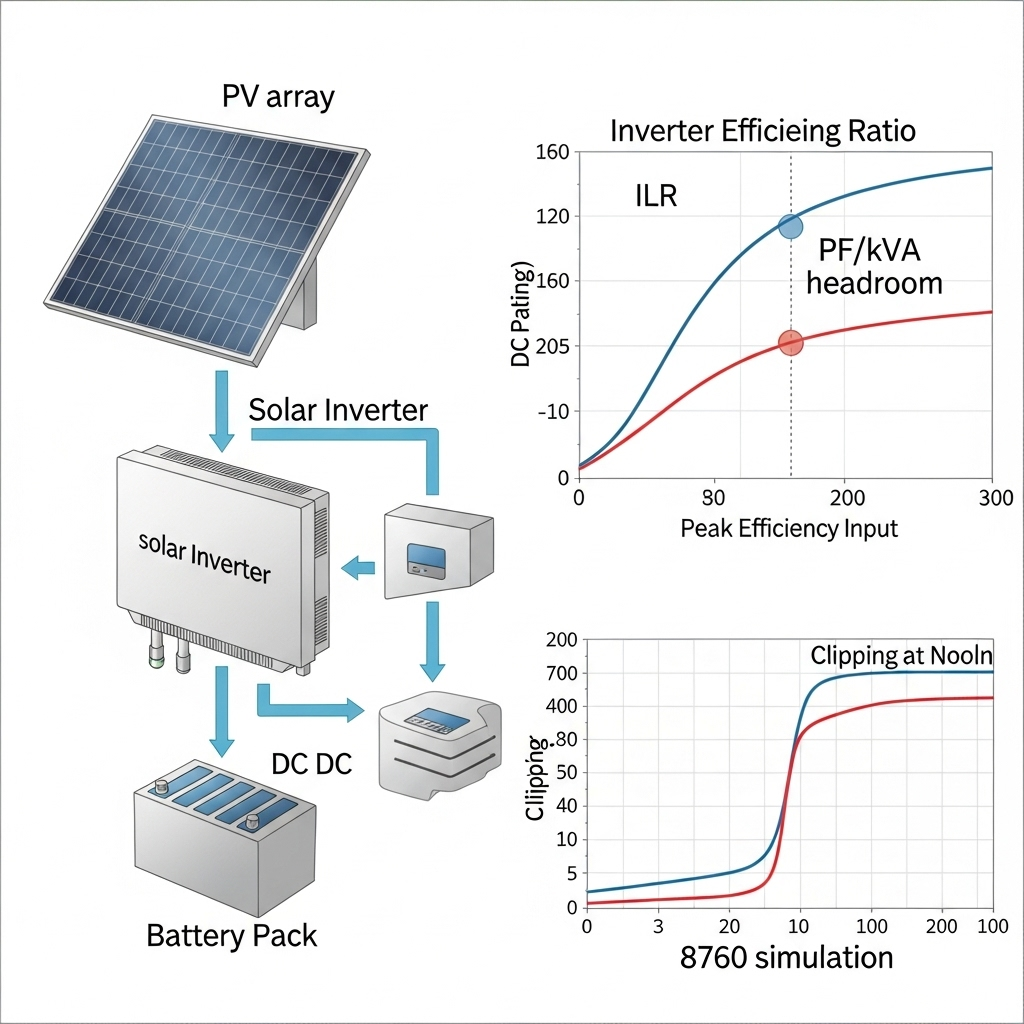
Inverter sizing decides yield, lifetime, and upgrade paths. You can avoid guesswork with measured data, clear rules, and simple math. This piece gives a practical sizing method that ties array size, inverter efficiency, and storage behavior into a single workflow.

What data-driven inverter sizing solves
- Prevents undersizing that throttles output on clear days.
- Controls clipping so mid-day peaks do not waste energy.
- Sets kVA headroom for power factor and grid support.
- Aligns with storage round-trip efficiency and charge windows.
Evidence matters. According to U.S. DOE Solar Energy Technologies Office, system performance swings with local irradiance, temperature, and component efficiency. A sizing process that uses hourly data captures these factors. IRENA’s Storage Valuation Framework shows that storage value depends on charge/discharge timing and round-trip efficiency. These are the same inputs you need to pick inverter size that works with batteries, not against them.
A clear, repeatable sizing method
1) Gather inputs
- Weather file: 8760 irradiance and ambient temperature (TMY or site logger).
- Module data: STC power, temperature coefficient, NOCT or thermal model.
- Array design: DC nameplate (kWp), tilt, azimuth, shading factor.
- Inverter data: efficiency curve vs load, max DC/AC current, kVA rating, PF range.
- Storage plan (if any): charge window, inverter coupling (AC or DC), round-trip efficiency.
IEA guidance emphasizes component-level performance inputs for realistic results. Use verified datasheets and a standard 8760 file for apples-to-apples comparisons.
2) Convert weather to DC array output
- Cell temperature: Tcell ≈ Tamb + (Irradiance/800 W/m²) × (NOCT − 20°C).
- Temperature loss: Pdc = Pstc × , with γ around −0.35%/°C for many modules.
- Apply soiling, mismatch, and wiring factors as percentages.
This step produces DC power each hour. EIA notes that seasonal sun angles and local climate shift output widely, so use site data where possible.
3) Map DC to AC with the efficiency curve
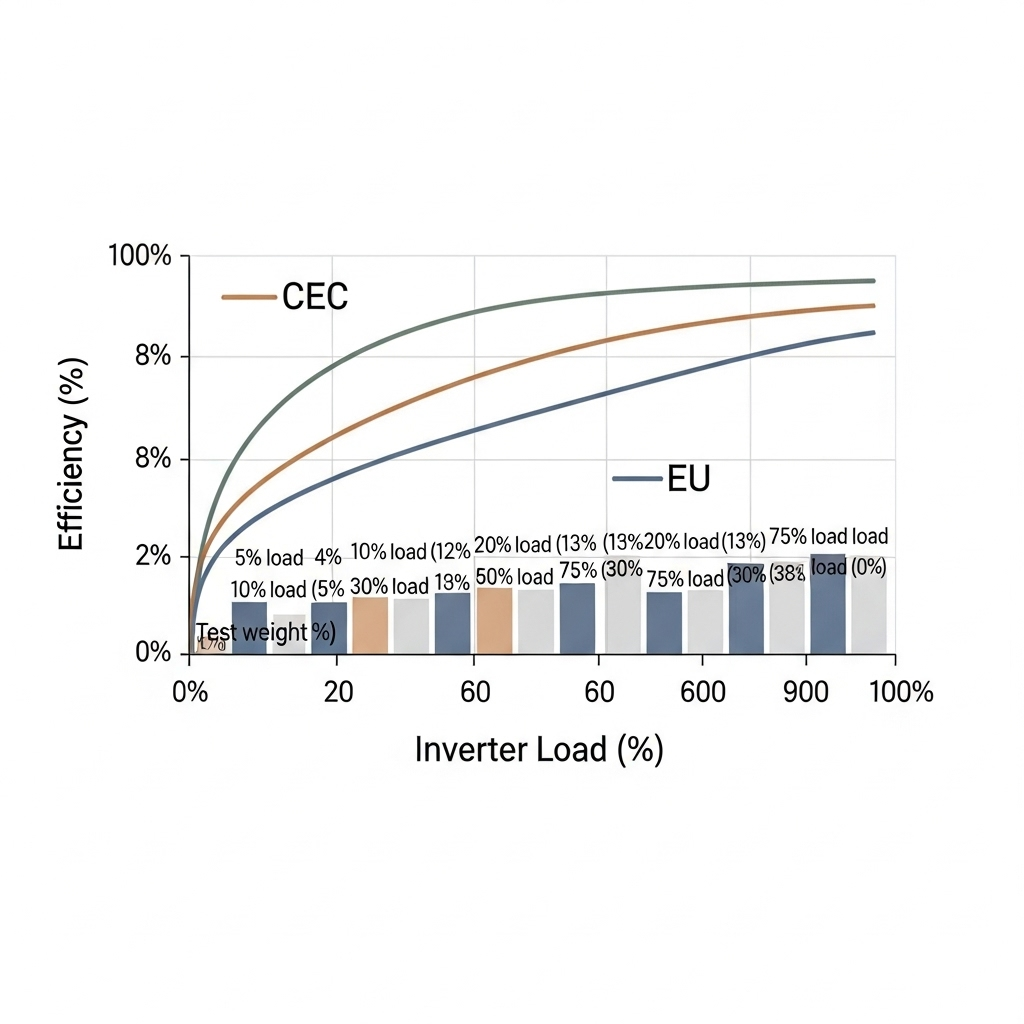
For each time step, AC power = ηinv(load) × min(Pdc, Pclip), where Pclip is the inverter AC limit adjusted to available kW at the chosen power factor. The curve-based approach beats a single “CEC weighted” number because part-load efficiency can differ by 1–2 percentage points across models. See basic weighting concepts in DOE resources.
4) Enforce constraints and grid support
- DC/AC ratio (ILR): test a range, e.g., 1.1–1.5.
- kVA and PF: ensure reactive power headroom for PF targets such as 0.95. IRENA’s Grid Codes for Renewable Powered Systems outline typical PF/kVA expectations.
- Thermal/altitude derating: reduce nameplate if site runs hot or at higher elevation.
5) Add storage logic if used
Model storage as a sink for mid-day surplus and a source at peaks, with round-trip efficiency applied. The Ultimate Reference to Solar Storage Performance summarizes practical ranges: LFP round‑trip efficiency often sits around 90–95% and cycle life reaches several thousand cycles at moderate depth of discharge. Use those ranges to cap realistic energy recapture from clipping.
6) Optimize to your metric
- For bill savings: maximize annual AC kWh delivered in high-tariff hours.
- For LCOE: minimize cost per kWh with capex, expected lifetime, and O&M. IRENA advises aligning technical options to value streams.
- For grid services: reserve headroom for fast frequency or voltage support. See grid-forming insights in the NREL roadmap (summary link via Lin et al.).
A quick calculator you can reproduce
Use this minimal stack to test inverter sizes with your 8760 data:
- Pick candidate AC sizes: e.g., 6, 7, 8, 10 kWac for a 9 kWp array.
- For each hour: compute Pdc (temperature-adjusted). Apply Pclip = AC_rating × PF × derating.
- AC_out = ηinv(Pdc/Pclip) × min(Pdc, Pclip). Sum to get annual kWh.
- Store surplus if battery available and SoC allows. Apply 90–95% round‑trip efficiency as suggested by the storage reference.
- Compare annual kWh, peak loads, and any PF penalties to pick the best size.
This simple loop mirrors practices in utility studies noted by IRENA and IEA: simulate full-year behavior, then decide.
Worked example with realistic inputs
Assumptions for a temperate site:
- Array: 10 kWp DC, soiling/mismatch/wiring combined = 8% loss.
- Annual plane-of-array yield: 1,600 kWh/kWp DC.
- Inverter weighted efficiency near 97% with a mild dip at very low load.
- PF target 0.98 for normal operation.
- No altitude derating, 40°C max ambient.
Annual DC energy ≈ 16,000 kWh. Net AC energy without clipping ≈ 16,000 × 0.92 × 0.97 = 14,291 kWh. Now compare DC/AC ratios.
| DC/AC (ILR) | Inverter AC rating | Estimated clipping loss | Annual AC kWh | Peak load fraction |
|---|---|---|---|---|
| 1.10 | 9.1 kWac | ~1% | ~14,148 | ~90% of nameplate at peak |
| 1.25 | 8.0 kWac | ~3.5% | ~13,791 | ~100% at peak more often |
| 1.35 | 7.4 kWac | ~6.5% | ~13,363 | frequent clipping at noon |
| 1.50 | 6.7 kWac | ~11% | ~12,719 | heavy noon clipping |
These values are illustrative; actual clipping depends on the site’s irradiance profile and temperature. A high-latitude site often sees lower clipping at the same ILR, while desert sites see higher clipping. For context on performance ranges and technology progress, see the IEA PV Technology Roadmap.
Where storage shifts the best inverter size
A small battery can soak up mid-day surplus and raise off-peak self-consumption. That can justify a slightly higher ILR or a slightly smaller inverter without sacrificing usable kWh. Practical storage performance needs living values, not nameplate. The Ultimate Reference to Solar Storage Performance reports commonly observed LFP behavior: round‑trip efficiency roughly 90–95% in normal conditions and strong cycle life at moderate depth of discharge. Use these figures in the model to avoid overestimating recapture from clipping.
- Rule of thumb: If estimated annual clipping is 3–6% and you have an LFP battery with ~92–95% round‑trip efficiency, a portion of that energy can move to evening peaks with minimal loss.
- Check grid support: If you plan to provide reactive power or frequency response, you may need extra kVA headroom. Research on grid-forming inverters (e.g., Lin et al., NREL roadmap) suggests reserving capacity for fast response can improve stability. See NREL grid-forming insights.
Efficiency curves matter more than a single number
Two 8 kW inverters with the same weighted efficiency can yield different energy due to part-load behavior. If your site sees many hours at 10–20% load, prefer models with higher low-load efficiency. This is consistent with performance-weighting practices covered by DOE and capacity factor discussions at EIA. In short, match the curve to your daily load and irradiance shape.
Data hygiene and modeling tips
- Use the same 8760 across candidates to keep comparisons fair.
- Validate the thermal model against at least a week of monitored data if available.
- Include PF schedules: e.g., 0.98 normal, 0.95 during grid events as per local rules. See IRENA grid code brief.
- Keep an audit trail: store assumptions, software version, and data sources. This aligns with good practice shown in IRENA innovation landscape.
Putting it all together
Pick an inverter size only after you see 8760 results for at least three ILR options, with and without storage. Check clipping, peak AC output, PF/kVA compliance, and economic value. Cross-check the result against parts availability and future plans, such as adding a battery or EV charger. Structured analysis beats rules of thumb in most cases.
Practical recommendations
- Residential rooftops: ILR near 1.2–1.35 often balances cost and clipping. Confirm with site weather. Add a small battery if mid-day export has low value.
- Small commercial: Reserve kVA headroom for PF and demand charge control. Target an inverter that holds 97%+ weighted efficiency at your common load band.
- Hybrid systems: For DC-coupled storage, choose an inverter with clear charge control windows. Use the storage performance reference to set realistic round-trip and cycle life.
For broader policy and technology context, see IRENA’s 2019 Global Energy Transformation and sector projections in NREL’s Electrification Futures Study. These sources support planning horizons and performance expectations used in sizing work.
FAQ
How to pick inverter size without guesswork?
Run an 8760 simulation. Test several ILRs, apply the real efficiency curve, include PF/kVA limits, then compare annual kWh and tariff-weighted value. Select the size that meets performance and compliance at the lowest energy cost.
Does higher ILR always reduce costs?
No. Moderate ILR can raise yield up to a point and then clipping grows. The best value depends on local tariffs, export rules, and storage. Use data, not a single rule.
How does storage change inverter sizing?
A battery can absorb mid-day surplus and shift energy to evening. Model round‑trip efficiency around 90–95% for LFP per the storage reference. That sets realistic recapture from clipping.
Should I reserve kVA for grid support?
If your utility requires PF near 0.95 or voltage support, leave headroom. See IRENA’s grid code brief for typical expectations.
What about efficiency ratings like CEC or EU?
Use them for screening. For final sizing, the full efficiency curve vs load is better. It captures low-load behavior that weighted numbers can miss.
Notes and disclaimer
Numbers in the table are illustrative. Validate with your site’s 8760 data and local codes. This content is for technical education and planning; not legal, tax, or investment advice.


Leave a comment
All comments are moderated before being published.
This site is protected by hCaptcha and the hCaptcha Privacy Policy and Terms of Service apply.