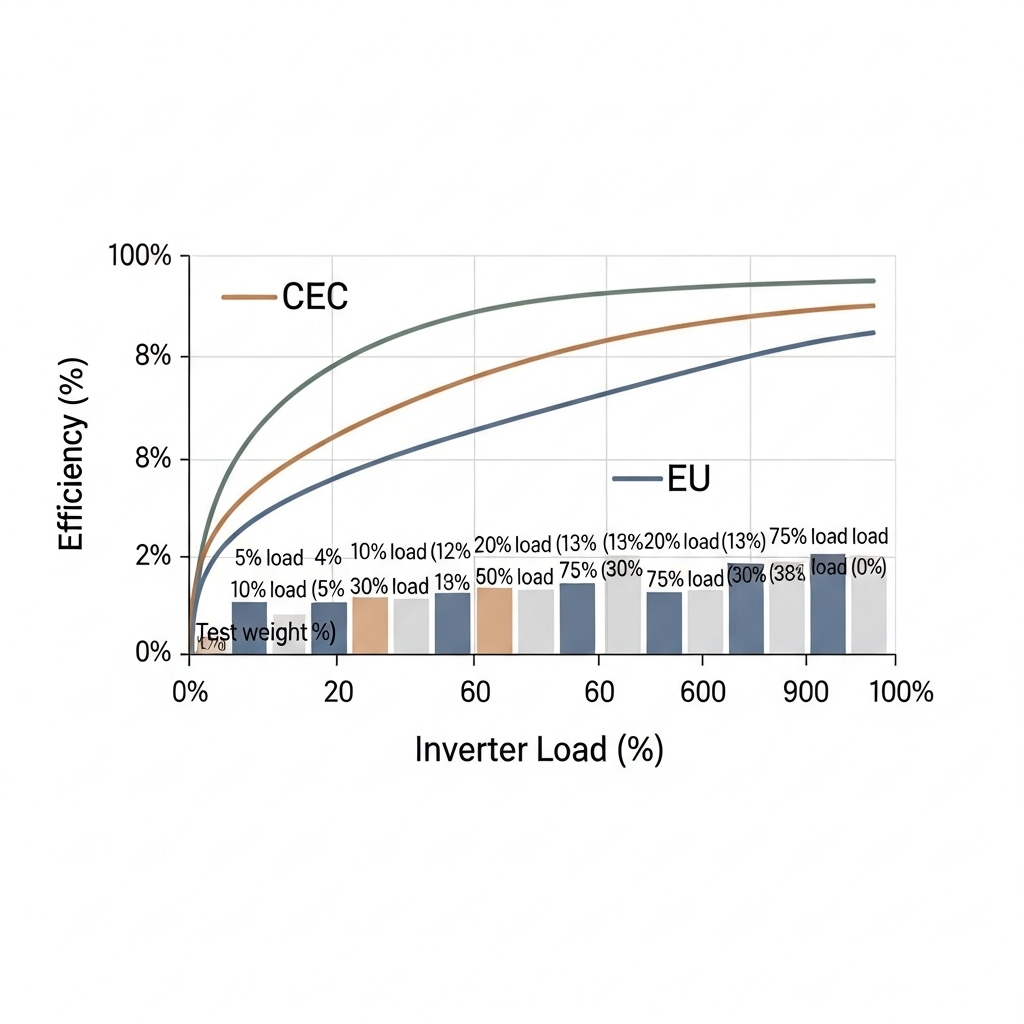
Efficiency curves are not marketing fluff. They describe how an inverter converts DC to AC across the full load range. The shape of that curve and the way it is weighted under CEC and EU methods can shift the headline number by half a percentage point or more. That swing affects energy yield, clipping, thermal behavior, and sizing choices for PV and hybrid systems.

What an inverter efficiency curve really tells you
An inverter seldom runs at a single operating point. Morning and late afternoon are light-load. Midday pushes toward rated power. Efficiency rises from low load, peaks near mid-to-high load, then tapers slightly near full power due to switching and thermal limits. You care about the average over time, not only the peak.
Two industry metrics turn the curve into a single number using load weights:
- CEC Weighted Efficiency (often used in North America)
- EU Weighted Efficiency (common in Europe)
Both average efficiency at specific load points, but with different weights. The difference reflects distinct irradiance profiles and historical test practices.
CEC vs EU weighting: formulas and load points
Below are the standard load points and weights used to compute weighted efficiency. Multiply each efficiency at the stated load by its weight, then sum.
| Method | Load points | Weights |
|---|---|---|
| CEC Weighting | 10%, 20%, 30%, 50%, 75%, 100% | 0.04, 0.05, 0.12, 0.21, 0.53, 0.05 |
| EU Weighting | 5%, 10%, 20%, 30%, 50%, 100% | 0.03, 0.06, 0.13, 0.10, 0.48, 0.20 |
Key takeaway: CEC puts heavy emphasis at 75% load, while EU leans strongly on 50% and includes 5% load. If your project runs often at mid load, EU may read lower than CEC for the same inverter. If it sits near 70–80% load at noon due to a higher DC/AC ratio, the CEC figure may track field results more closely.
Worked example with real numbers
Consider a modern transformerless string inverter. The datasheet or test report lists efficiency at typical load points. Use the same curve for both methods to show how the score shifts only due to weighting.
| Load | Efficiency |
|---|---|
| 5% | 92.0% |
| 10% | 95.0% |
| 20% | 97.0% |
| 30% | 97.5% |
| 50% | 98.0% |
| 75% | 98.2% |
| 100% | 97.8% |
- CEC Weighted = 0.04×95.0 + 0.05×97.0 + 0.12×97.5 + 0.21×98.0 + 0.53×98.2 + 0.05×97.8 = 97.87%
- EU Weighted = 0.03×92.0 + 0.06×95.0 + 0.13×97.0 + 0.10×97.5 + 0.48×98.0 + 0.20×97.8 = 97.42%
The same hardware scores 97.87% vs 97.42% because EU includes a 5% load penalty and places less weight at 75%. The gap here is 0.45 percentage points. Over large fleets and multi‑decade lifetimes, that difference can move energy models and warranties.
Why this matters for inverter sizing
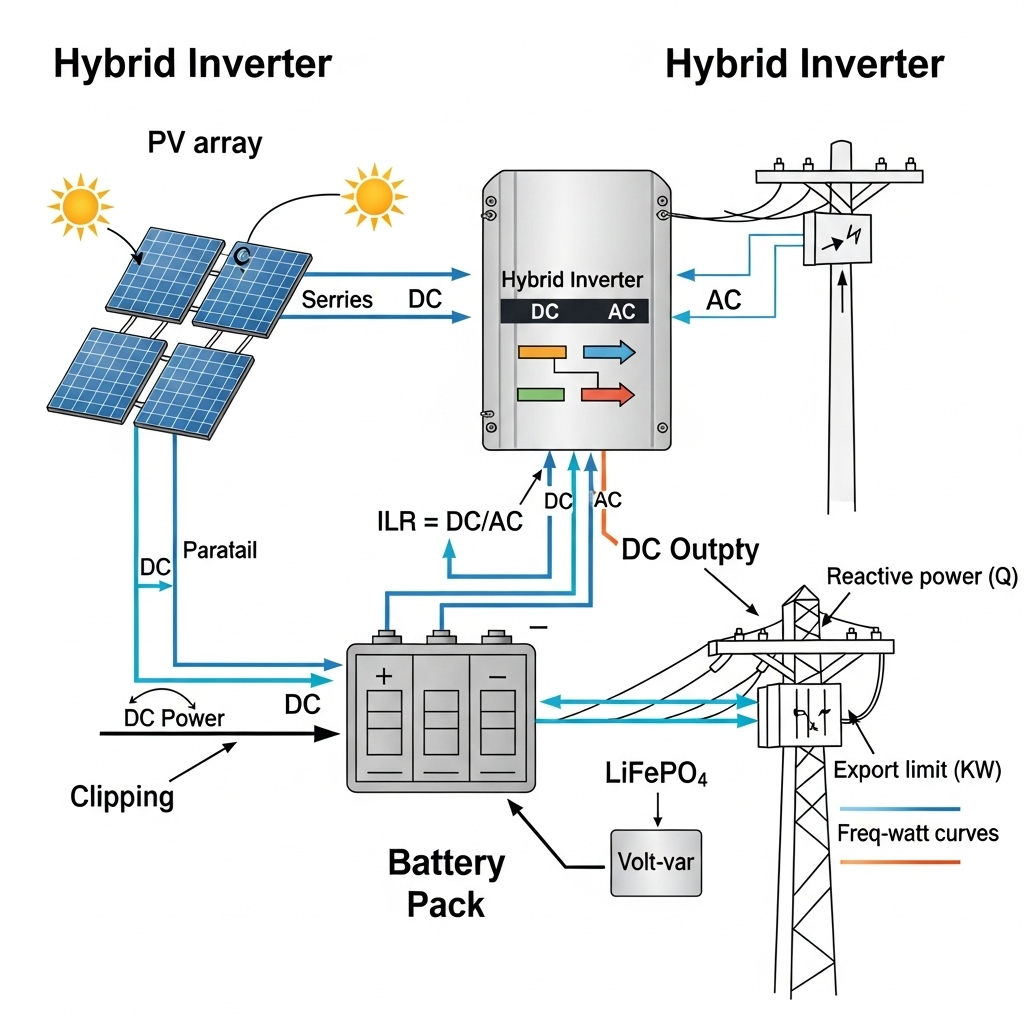
Inverter sizing aligns the DC array with the AC rating. The DC/AC ratio (also called ILR) pushes operating points along the curve:
- Lower ILR (1.1–1.2): The inverter spends more time at mid load. EU-weighted numbers can reflect field averages better.
- Higher ILR (1.3–1.6): More time near 70–90% at peak sun. The CEC emphasis at 75% may line up with observed behavior.
- Very high ILR (>1.6): Expect clipping on clear days. Weighted metrics matter less than clipping and thermal headroom; still, curve shape at 75–100% load remains important.
Ambient temperature and altitude shift the actual curve. Hotter conditions reduce efficiency and continuous power. So a high CEC number in a cool lab may overstate midday performance in a hot site. Check the derating graphs on the datasheet.
Back-of-envelope yield impact
Assume identical sites, same array, and two inverters with similar shapes but different weighted scores: 97.9% (CEC) vs 97.4% (EU on the same curve). If the time-at-load distribution resembles EU’s weights, the real-life average can swing about 0.3–0.5%. On a 1 MWdc rooftop producing 1,400 MWh/year, that is roughly 4–7 MWh/year. Over 15 years, it accumulates. The IEA manufacturing analysis uses a 25‑year lifetime assumption in cost frameworks, which makes small efficiency deltas financially visible in LCOE.
How to use CEC and EU numbers in design
- For cool, high-irradiance regions with ILR ≥1.3, put more weight on CEC when screening inverters. Validate with site irradiance histograms.
- For diffuse or variable climates, or ILR ≤1.2, EU may better track midsummer and shoulder-season averages.
- Always compare the full curves, not just the single metric. A unit with higher EU can still lose at high load if its curve dips near 90–100%.
As a quick check, ask vendors for efficiency at 5%, 10%, 20%, 30%, 50%, 75%, and 100% load, then compute both scores. Keep the math transparent in your energy model.
Storage and hybrid systems: why weighting still matters
Hybrid systems move the inverter off the PV-only curve. Charge and discharge windows shift operating load. DC-coupled storage can smooth peaks and reduce clipping, moving time from 90–100% load down toward 50–80%. AC-coupled storage adds separate conversion steps. Each step has its own curve and tare draw.
The IRENA Electricity Storage Valuation Framework highlights that value changes with C‑rate and service mix. Its example weightings by C‑rate indicate fast services favor high power capability and efficiency at higher instantaneous load, while energy shifting favors duration and mid-load efficiency. Those ideas align with using both CEC and EU perspectives for hybrid sizing.
A practical cross-check: the independent reference at this solar and storage performance compendium aggregates typical inverter weighted efficiencies in the mid‑ to high‑90% range and notes part‑load penalties and battery throughput limits. Use these ranges to sanity-check vendor claims and to set realistic round‑trip efficiency in models for DC‑ and AC‑coupled designs.
Round‑trip efficiency stack
- PV DC wiring and MPPT: ~0.5–1.5% loss depending on voltage and temperature.
- Inverter conversion at operating load: based on the curve and weighting (often 97–98% headline; lower at light load).
- Battery charge and discharge: depends on chemistry and C‑rate; round‑trip often 90–96% for Li‑ion packs under moderate C‑rates.
- Auxiliaries (cooling, control, nighttime tare): small but persistent; verify the datasheet figure.
Set round‑trip numbers conservatively for the duty cycle you expect. For peak‑shaving at high C‑rates, focus on high‑load efficiency; for energy shifting, mid‑load points matter more.
Reality checks from authoritative data
- The IEA Energy Technology Perspectives 2024 notes standardized lifetime and utilization assumptions in clean tech cost models. With multi‑decade horizons, a 0.3–0.5% conversion difference is economically meaningful.
- The EIA shows PV output varies by region and season; time at part load is common, which makes the low‑load portion of the curve relevant for annual yield.
- Energy.gov provides background on PV system components and performance factors, supporting the need to evaluate conversion efficiency with operating conditions in mind.
- IRENA storage valuation links service value to power capability and duty cycle, reinforcing why efficiency at the specific operating point matters.
- The IEA clean tech manufacturing report also uses consistent WACC and lifetime assumptions, a reminder to align efficiency inputs with financial modeling windows.
Spec-sheet traps and field tips
- Check both CEC and EU values. If only one is listed, request the curve or the raw data points.
- Look for nighttime consumption. A few watts 24/7 adds up over years.
- Verify efficiency at nominal operating temperature. Ask for curves at 25°C and 45°C ambient.
- Confirm MPPT voltage window at your site’s temperature range. Staying near the inverter’s sweet spot reduces conversion loss.
- For hybrid projects, ask for charge/discharge efficiency vs DC bus voltage and battery C‑rate. Align with your duty cycle.
Sizing in practice: quick scenarios
Rooftop commercial, ILR 1.25
Expect many hours around 40–70% load. The EU-weighted score often approximates field averages. Yet, if your site is cool and sunny at noon, add a check using CEC weights to capture midday gain.
Utility-scale, ILR 1.45 with DC-coupled storage
Storage shifts energy away from clipping. The inverter may operate more often at 60–85% load during discharge windows. Here, the CEC emphasis at 75% helps you assess peak-period conversion. Validate with dispatch modeling.
Hot climate, ILR 1.30
Thermal derating reduces efficiency near full power. A unit with the same headline rating but better high‑temp curve can outperform. Ask for temperature‑corrected weighted results.
What to report to stakeholders
- Both weighted efficiencies, with formulas and load points.
- The full efficiency curve and any temperature derate curves.
- Assumed ILR and expected time-at-load histogram from your energy model.
- Round‑trip stack for hybrid systems, with conservative tare assumptions.
This documentation supports bankability and aligns with energy and cost modeling standards noted by IEA and technical resources at Energy.gov.
Key takeaways
- CEC favors high-load performance; EU emphasizes mid-load and penalizes very light load.
- Match the weighting to your site’s load distribution, ILR, and climate.
- Use both scores, the full curve, and temperature data to avoid surprises.
- For storage, align efficiency priorities with the duty cycle and C‑rate, as highlighted by IRENA.
Technical note: Numbers above are illustrative. Always verify with accredited test reports and project‑specific models.
FAQ
What is the main difference between CEC and EU efficiency?
CEC puts the biggest weight at 75% load, while EU places the largest weight at 50% and also includes 5% load. That alone can shift the score by 0.2–0.6 percentage points for the same inverter.
Which metric should I use for inverter sizing?
Use both. If your site spends more time at mid load, EU can track reality well. If the inverter runs near 70–85% during peak hours due to higher ILR, CEC may be a closer proxy. Always check the entire curve.
How do temperature and altitude affect weighted efficiency?
Higher temperature and altitude can reduce efficiency and power. Ask for temperature‑corrected curves and apply them to your time‑at‑load distribution to refine results.
How do storage systems change the picture?
Storage shifts energy across the day and can reduce clipping. DC‑coupled systems often move the inverter toward mid‑to‑high load during discharge, making the 50–75% portion of the curve more important.
Are the published numbers bankable?
They are useful benchmarks. For financing, request certified test data, round‑trip efficiency breakdowns, and modeling consistent with sources such as IEA and Energy.gov.
Disclaimer: Technical content only. Not legal, investment, or financial advice.


Leave a comment
All comments are moderated before being published.
This site is protected by hCaptcha and the hCaptcha Privacy Policy and Terms of Service apply.