DC/AC ratio and inverter loading shape real solar yield more than most design choices. Set them well and you gain energy all year, keep the inverter in its high-efficiency zone, and leave headroom for grid support and batteries. This piece focuses on practical math, climate effects, and sizing ranges you can use today.

Key definitions and why they matter
DC/AC ratio (ILR)
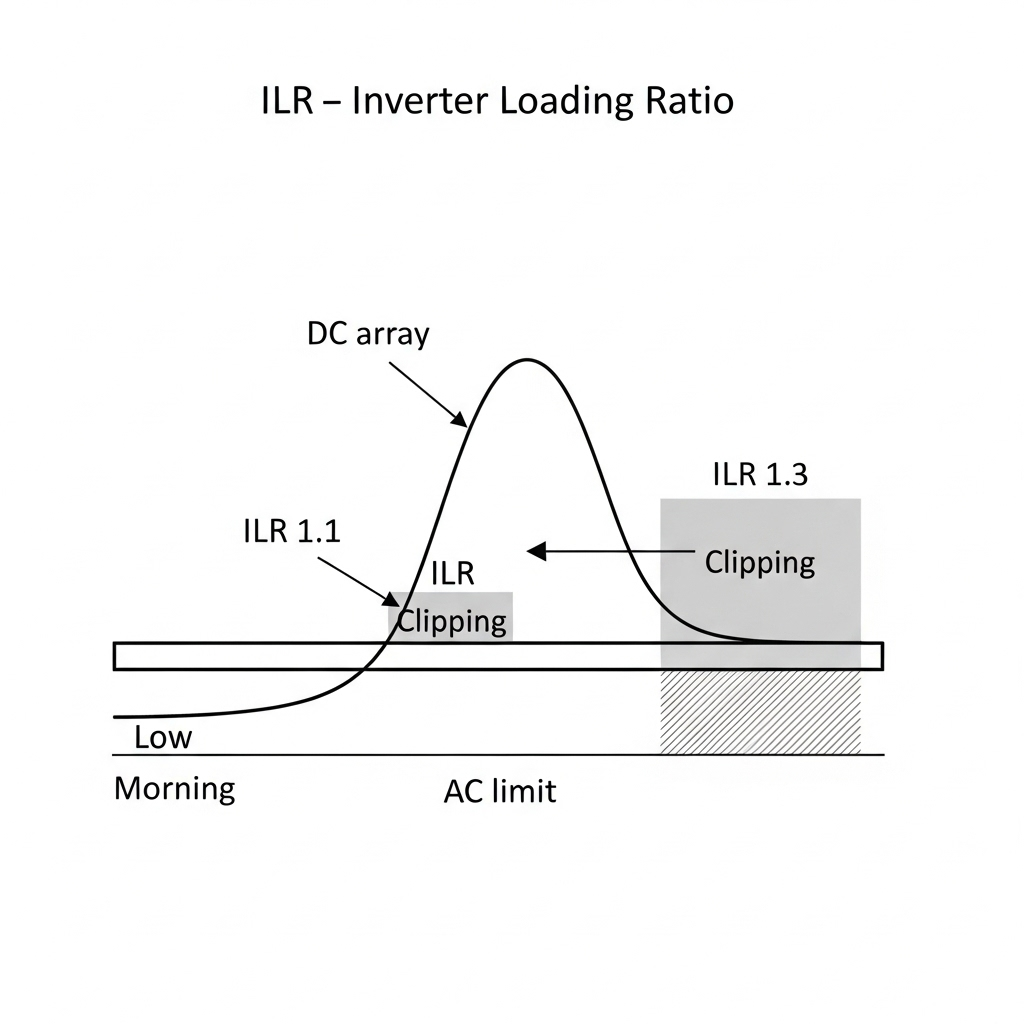
DC/AC ratio, also called inverter loading ratio (ILR), is the array’s STC power divided by the inverter’s AC nameplate power. ILR = PDC, STC / PAC, rated. A higher ILR feeds more energy during long shoulder hours and in winter, at the cost of some midday clipping on clear, cool days.
According to Next Generation Wind and Solar Power by the IEA, plants typically size DC above AC by at least 10%, and ILR is the standard term in utility practice. The companion full report notes the same definition and shows how higher ILR increases the time spent at full AC output here.
Inverter loading
Inverter loading at any moment is the AC output divided by the inverter’s AC nameplate. You can estimate the instantaneous loading from DC power and inverter efficiency: Loading ≈ (PDC × ηinv) / PAC, rated. If the result is above 1.0, clipping caps output at 100% loading.
IEA System Integration of Renewables explains that PV arrays reach rated power only for a short window under STC-like conditions. This is why a modest ILR above 1.0 raises annual AC energy even with some clipping.
Practical math: calculate inverter load ratio and check clipping
Step-by-step method
- Collect array STC size (kWp), inverter AC rating (kWac), module temperature coefficient (e.g., −0.36%/°C), and a typical efficiency curve for the inverter.
- Compute ILR = kWp / kWac. This is your DC/AC ratio.
- Estimate DC power for a representative hour using irradiance and cell temperature. A quick estimate: PDC ≈ kWp × (G/1000) × .
- Convert to AC: PAC ≈ PDC × ηinv(load). Cap at PAC, rated to account for clipping.
Worked snapshot: 10.4 kWp array on an 8 kWac inverter (ILR = 1.3). At G = 800 W/m² and Tcell = 50°C, γ = −0.36%/°C → temperature factor ~0.91. PDC ≈ 10.4 × 0.8 × 0.91 = 7.6 kW. With 97% inverter efficiency, PAC ≈ 7.4 kW, loading ≈ 92% (no clipping). On a clear, cool hour at G = 1000 W/m² and Tcell = 35°C, PDC ≈ 10.4 × 1.0 × 0.964 = 10.0 kW; AC would be ~9.7 kW, but is clipped to 8.0 kW.
How ILR changes annual yield and clipping
The table below shows indicative outcomes for fixed-tilt arrays in temperate and hot sites. Values reflect modeled results using typical module coefficients and a representative inverter efficiency curve. They are not universal and should be validated per site.
| DC/AC Ratio (ILR) | Temperate site: annual clipping | Temperate site: AC yield gain vs ILR 1.0 | Hot site: annual clipping | Hot site: AC yield gain vs ILR 1.0 |
|---|---|---|---|---|
| 1.10 | ~0.5–1.5% | ~2–4% | ~0.2–1.0% | ~1–3% |
| 1.30 | ~2–6% | ~4–8% | ~1–3% | ~3–6% |
| 1.50 | ~5–12% | ~6–10% | ~2–5% | ~4–7% |
Why the spread? Hotter modules run further below STC, so they clip less for the same ILR and can justify a higher DC/AC ratio. The IEA notes that higher ILR increases full-power hours on the AC side, which often outweighs midday caps on clear, cool days source.
PF, kVA limits, and real loading headroom
Grid codes often require reactive power support. That means a kVA ceiling may limit real power. Always compute active power headroom: P = S × PF.
| Inverter rating | Required PF | Max real power (kW) | Implication |
|---|---|---|---|
| 10 kVA | 0.95 | 9.5 | 5% headroom must be reserved for vars; DC/AC sizing should reflect this. |
| 100 kVA | 0.90 | 90 | 10% of nameplate reserved; real-power clipping can occur earlier. |
For utility interconnections, add PF requirements to your loading checks. This aligns with grid-support needs seen in advanced microgrids. In a DOE-backed testbed, 24 grid-forming inverters achieved autonomous blackstart and resynchronization across four microgrids, showing the value of inverter headroom for stability U.S. DOE SETO success story.
Climate, tilt, and tracking shape the best ILR
Array geometry changes the DC shape feeding your inverter. The IEA shows how tracking stretches the power curve, raising shoulder-hour energy compared with fixed tilt reference. A few practical notes:
- Cool, clear climates: lower module temperatures raise DC power and clipping risk. Consider ILR toward the low end of your target band.
- Hot or high-irradiance sites: higher ILR is often justified; thermal derating of inverters at high ambient also nudges you to verify headroom.
- Winter-tilt emphasis: greater tilt can increase low-sun performance, improving returns from modest oversizing.
Storage and hybrid inverters: recapturing clipped watts
A battery can soak midday peaks and feed evening loads. That reduces clipping and boosts self-consumption without oversizing the AC intertie. According to Ultimate Reference: Solar + Storage Performance, LiFePO4 storage offers high round-trip efficiency and stable cycle life, making it suitable for daily charge during midday peaks. In practice, round-trip efficiency near the low-to-mid 90% range and moderate C-rates support ILR choices that push more energy into a mid-day charge window.
For DC-coupled hybrids, you can route surplus DC to the battery before the AC bottleneck. For AC-coupled systems, check the inverter-to-inverter power path and round-trip losses carefully, and size the battery power to align with the expected clipped peak (for example, a 3–5 kW battery inverter paired with an 8 kW PV inverter in a residential case).
Recommended ILR bands by segment
- Residential rooftop: ILR ~1.10–1.35. Favor the low end for cold, clear sites or strict export caps; the high end for hot climates or self-consumption with batteries.
- Commercial and industrial: ILR ~1.20–1.50. Roof geometry and weekday load profiles reward broader shoulders and some midday capping.
- Utility-scale: ILR ~1.30–1.55+. Validate against curtailment patterns, PF requirements, tracker behavior, and O&M strategy. The IEA’s framing of ILR and full-power hours is a useful benchmark IEA full report. For broader PV performance context, see IRENA.
A compact workflow to size and verify
- Set targets: energy yield, export limits, PF/kVA obligations, and storage goals.
- Pick an initial ILR from the ranges above.
- Check thermal and altitude derating on the inverter’s datasheet and adjust AC nameplate if needed.
- Estimate clipping on representative cool-clear and hot days with the quick math above; iterate ILR to keep clipping in your acceptable band.
- Account for PF headroom and grid-support modes (volt-var, frequency-watt). Recompute loading with P = S × PF.
- If adding batteries, size battery charge power to match the expected clipped peak and capacity to cover the desired evening load window. Leverage LiFePO4 performance data as referenced in the Solar + Storage Performance piece.
- Validate with site-specific simulations and measured efficiency curves. Energy statistics from EIA and engineering reports from DOE provide reliable boundary checks.
Worked policy and grid notes
ILR is a design lever, but compliance rules define the box you operate in. Many interconnections cap export power in kW and require reactive support near PF 0.95. Keep enough kVA headroom to deliver vars without tripping real-power limits. The role of advanced, grid-forming inverters in resilience is growing, underscored by the DOE project noted earlier. That trend makes accurate loading calculations even more valuable.
What you gain from careful DC/AC choices
- Higher annual energy without overpaying for AC capacity.
- Better inverter efficiency by staying near the sweet spot for more hours.
- Easier integration with LiFePO4-based storage to recapture clipped energy.
- Predictable behavior under PF/kVA constraints and grid-support modes.
This content reflects field experience with PV and storage across residential, C&I, and microgrid projects, aligned with insights from the IEA and DOE sources cited above.
FAQs
How do I calculate inverter load ratio quickly?
Divide the array nameplate DC power at STC by the inverter AC nameplate in kW. Example: 13.2 kWp on a 10 kWac inverter → ILR = 1.32. For momentary loading, multiply live DC power by inverter efficiency and divide by AC nameplate.
Is a higher DC/AC ratio always better?
No. Gains taper as clipping rises. Cold climates, strict export caps, or tight PF requirements favor lower ILR. Hot sites or systems with batteries can justify higher ILR because clipping is lower and midday surplus can be stored.
Does a bigger inverter improve efficiency?
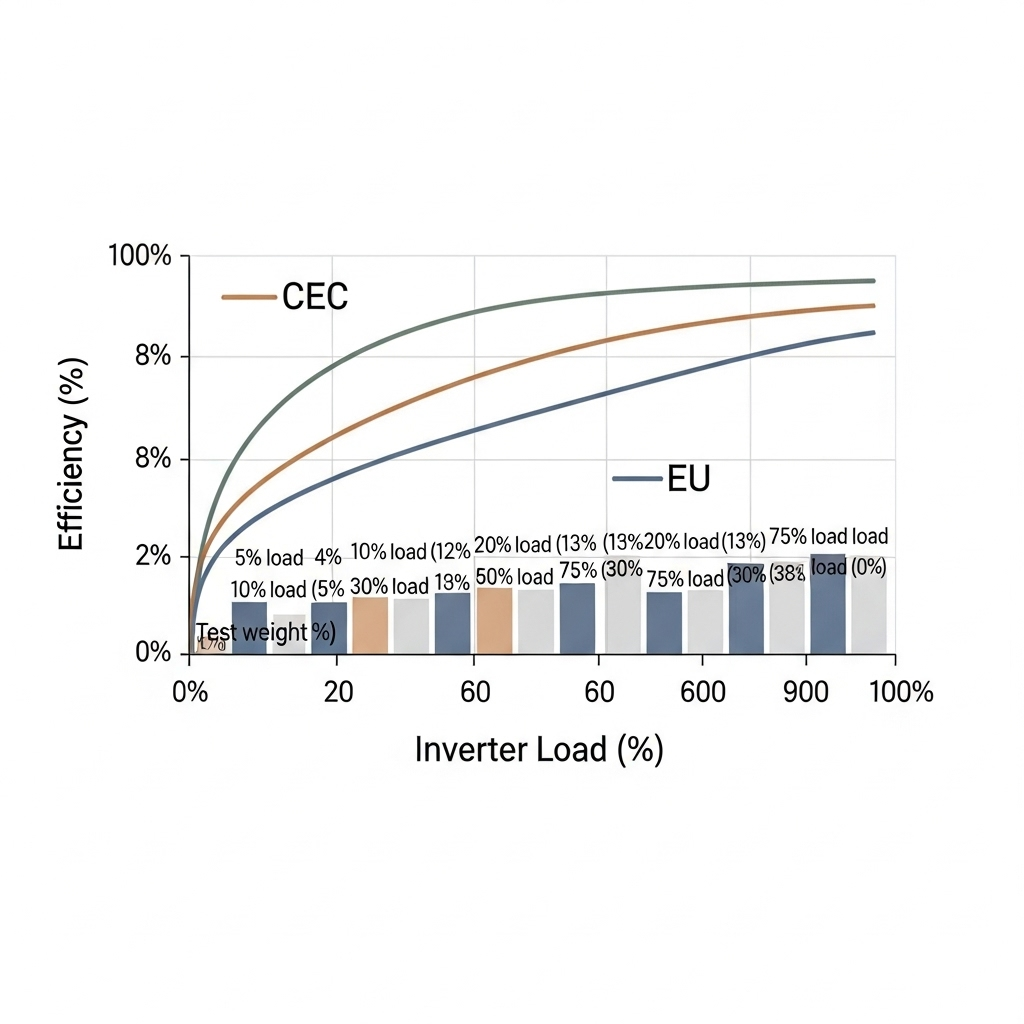
Not automatically. Inverter efficiency curves vary. Many units peak around 30–70% loading. Oversizing the inverter too far can push it into lower efficiency for much of the year, while undersizing drives excess clipping.
How do power factor rules affect my sizing?
If PF must be 0.95 at full load, only 95% of the inverter kVA can be real power. Reserve that margin in your calculations to avoid unexpected clipping while delivering vars.
Can storage eliminate clipping?
It can reduce it. DC-coupled batteries are effective because they absorb surplus before the AC limit. AC-coupled setups work too, but route power through an extra conversion step. See LiFePO4 performance notes in the Solar + Storage Performance reference.
Any caveats?
This is technical information, not legal or interconnection advice. Always confirm grid codes and equipment ratings with your local authority and manufacturer specifications.
Disclaimer: Informational content only; not legal, engineering, or financial advice.


Leave a comment
All comments are moderated before being published.
This site is protected by hCaptcha and the hCaptcha Privacy Policy and Terms of Service apply.