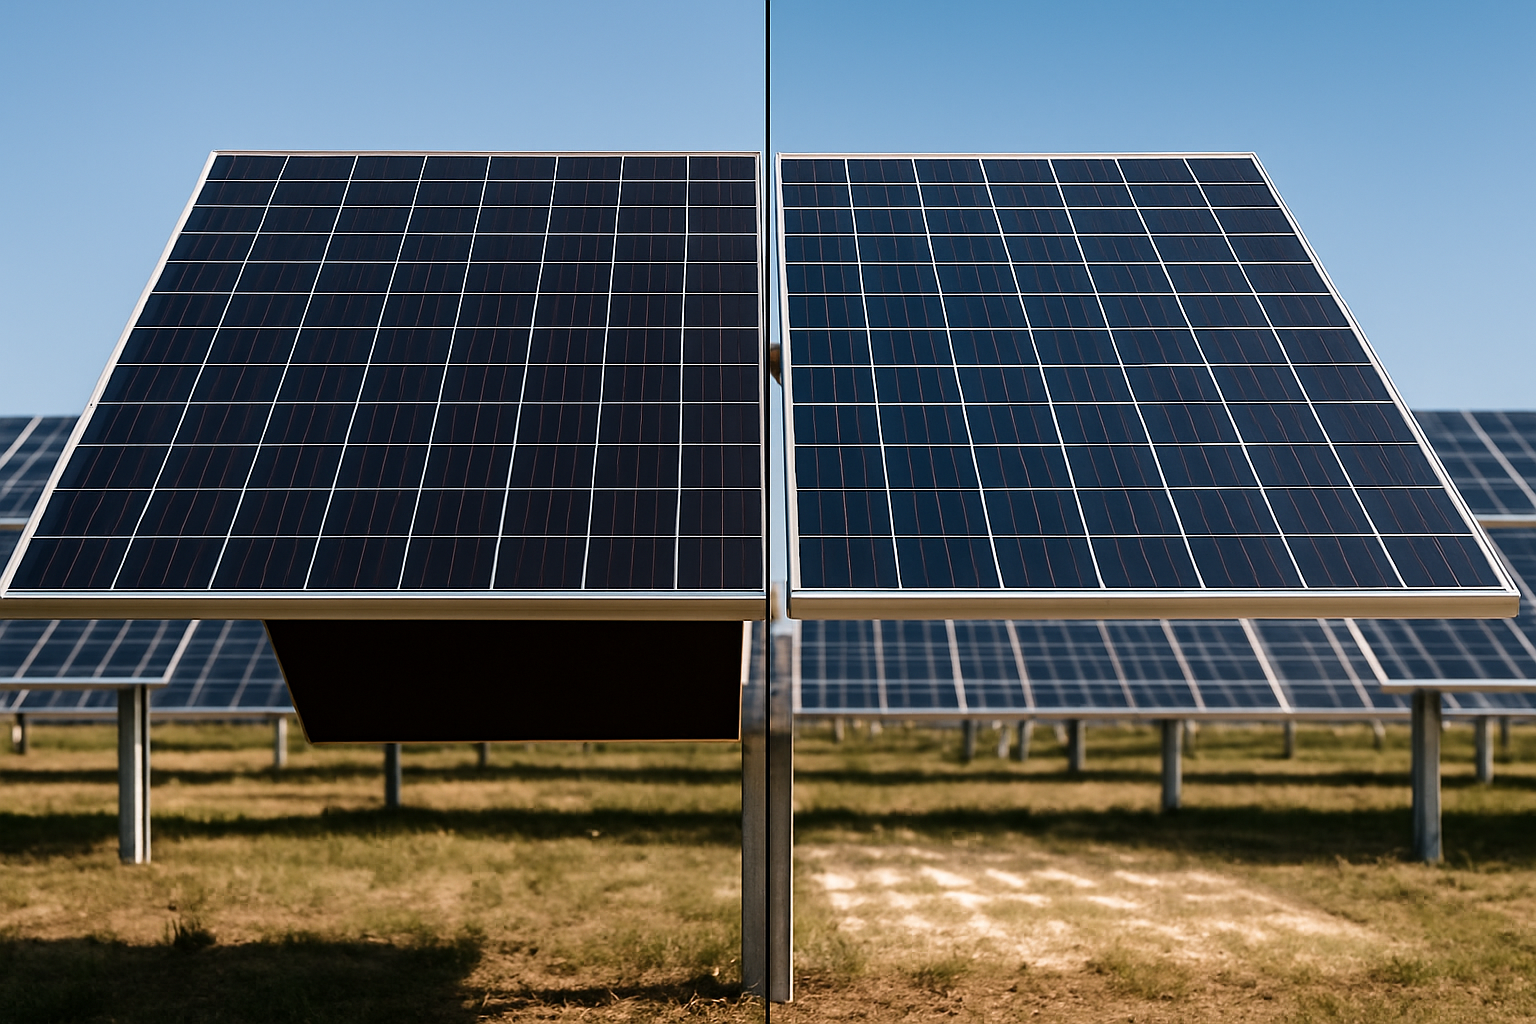
Solar energy offers a powerful path to energy independence, transforming how we power our homes and businesses. As more individuals and organizations adopt solar, understanding the long-term performance of photovoltaic (PV) systems becomes increasingly important. A critical aspect of this performance is degradation—the gradual reduction in a solar panel's ability to generate power over time. New fleet-scale data provides a clearer picture of this phenomenon, offering valuable insights for anyone relying on solar power.

Grasping PV Degradation: The 0.75%/Year Insight
PV degradation refers to the natural decline in a solar panel's power output over its operational lifespan. This is a normal process, but accurately quantifying it helps in predicting system longevity and financial returns. Historically, estimates varied, often relying on smaller datasets or theoretical models.
What is PV Degradation?
Solar panels, like most technologies, experience a gradual reduction in efficiency as they age. This decline is known as PV degradation. It can be caused by various factors, including exposure to UV light, temperature fluctuations, humidity, and mechanical stress. While modern panels are built for durability, some level of degradation is inevitable. Knowing the rate of this decline is crucial for accurate energy yield predictions and system maintenance planning.
Fleet-Scale Data: A New Standard for Accuracy
Recent analysis, drawing from extensive fleet-scale data across the United States, provides a highly confident estimate of PV degradation. This research indicates that the median performance loss for the entire U.S. PV fleet is around 0.75% per year. This finding, based on direct measurements from hundreds of PV systems, offers a more robust and representative figure than many previous studies. According to a report from the U.S. Department of Energy, this analysis breaks new ground by calculating degradation rates with a higher level of confidence, given the diversity of technologies and locations monitored across the fleet.
Factors Influencing Solar System Performance
While the median degradation rate provides a national benchmark, several factors can influence the performance of individual solar systems. Knowing these elements helps you optimize your specific installation.
Climate and Location Effects
The environment where your solar panels operate plays a significant role in their long-term performance. The fleet-scale analysis found that the degradation rate is climate-dependent. Panels tend to degrade slower in cooler climates. This suggests that geographical location and local weather patterns are important considerations when assessing expected system longevity and output.
Technology Impact and System Design
Interestingly, the recent analysis revealed that performance loss rates did not differ much on account of different module technologies or other factors. This indicates a general consistency in degradation across various panel types within the monitored fleet. Beyond the panels themselves, the overall system design significantly impacts performance. The "performance ratio" is a key metric that accounts for losses due to the inverter, less-than-optimal module direction and tilt, and shading effects. The IEA's Solar Energy Perspectives report suggests that reasonable estimates for average performance ratios are 75% for systems. Maximizing this ratio through careful design and installation ensures you capture as much solar energy as possible.
Optimizing Your Solar Investment: Practical Strategies
Grasping PV degradation is not just about knowing a number; it is about using that knowledge to make informed decisions and maximize the return on your solar investment. Our experience in the solar industry, particularly with lithium batteries, energy storage systems, and off-grid solutions, highlights the importance of proactive management and quality components.
Performance Monitoring and Benchmarking
For PV plant owners and operators, the fleet-scale data provides a valuable tool for benchmarking performance against the industry average. You can use this information to better understand which factors contribute to your fleet’s performance and to improve the efficiency of your operations. Regular monitoring allows you to identify underperforming assets early, such as a panel degrading faster than the 0.75% median, and take corrective action. This proactive approach helps maintain optimal energy output throughout your system's life, directly impacting its economic viability. Accurate PV system performance assessments can boost solar deployment by attracting investors and project developers, as highlighted by the U.S. Department of Energy. By providing clearer inputs to lifetime power production estimates, this data strengthens the financial case for solar projects, making them more attractive for financing and investment.
Enhancing Longevity and Efficiency
Investing in reliable, scalable energy solutions is paramount for long-term success. This includes selecting high-quality components such as robust lithium iron phosphate (LiFePO4) batteries, efficient solar inverters that convert direct current to alternating current with minimal loss, and well-integrated home energy storage systems. These components work together seamlessly to ensure your solar power is captured, converted, and stored effectively, even as panels experience natural degradation. Our focus on developing integrated ESS solutions, combining advanced lithium batteries with hybrid inverters and solar panels, aims to deliver superior system performance and extended operational life.
The economic landscape for solar continues to improve, making such investments even more attractive. According to IRENA's Renewable Power Generation Costs in 2024 report, the global weighted average Levelised Cost of Electricity (LCOE) of utility-scale solar PV remained flat in 2024 at USD 0.043/kWh, representing a significant 90% reduction from 2010. This dramatic decrease in cost underscores the increasing economic viability and competitiveness of solar projects.
Consider the energy payback time—the period required for a solar system to generate the amount of energy equivalent to that consumed during its production. Recent studies referenced by the IEA show energy payback times for commercial PV systems under Southern European sunshine ranging from 0.7 to 2.5 years, depending on the technology and the power mix in manufacturing countries. This rapid payback demonstrates the strong environmental and economic benefits of solar energy, further solidifying its role in achieving energy independence.
The table below illustrates the dramatic decrease in solar PV costs over time, making it a highly competitive energy source:
| Year | Global Weighted Average LCOE (Utility-Scale Solar PV) | Reduction from 2010 |
|---|---|---|
| 2010 | ~USD 0.43/kWh | - |
| 2024 | USD 0.043/kWh | 90% |
Data Source: IRENA Renewable Power Generation Costs in 2024
The Path to Sustainable Energy Independence
Grasping the median PV loss rate of 0.75% per year, supported by robust fleet-scale data, empowers you to make more accurate predictions about your solar system's performance and financial viability. By focusing on quality components, smart system design, and continuous monitoring, you can mitigate degradation effects and ensure your solar investment delivers consistent, reliable power for decades. Our commitment is to provide reliable and scalable energy solutions, helping you achieve true energy independence through advanced lithium battery technology and integrated energy storage systems, whether for residential, commercial, or off-grid applications.
Frequently Asked Questions
What is the typical degradation rate for solar panels?
Fleet-scale data indicates that the median performance loss rate for solar panels across the U.S. PV fleet is approximately 0.75% per year. This figure provides a reliable benchmark for expected long-term performance.
Does climate impact solar panel degradation?
Yes, climate does influence degradation. Studies show that solar panels tend to degrade slower in cooler climates. This highlights the importance of considering your specific geographical location when estimating system longevity.
How can I monitor my solar system's performance?
You can monitor your solar system's performance through dedicated software tools and by regularly reviewing energy production data. Benchmarking your system against industry averages, such as the 0.75% median degradation rate, helps identify any underperformance and allows for timely optimization of your operations.


Leave a comment
All comments are moderated before being published.
This site is protected by hCaptcha and the hCaptcha Privacy Policy and Terms of Service apply.