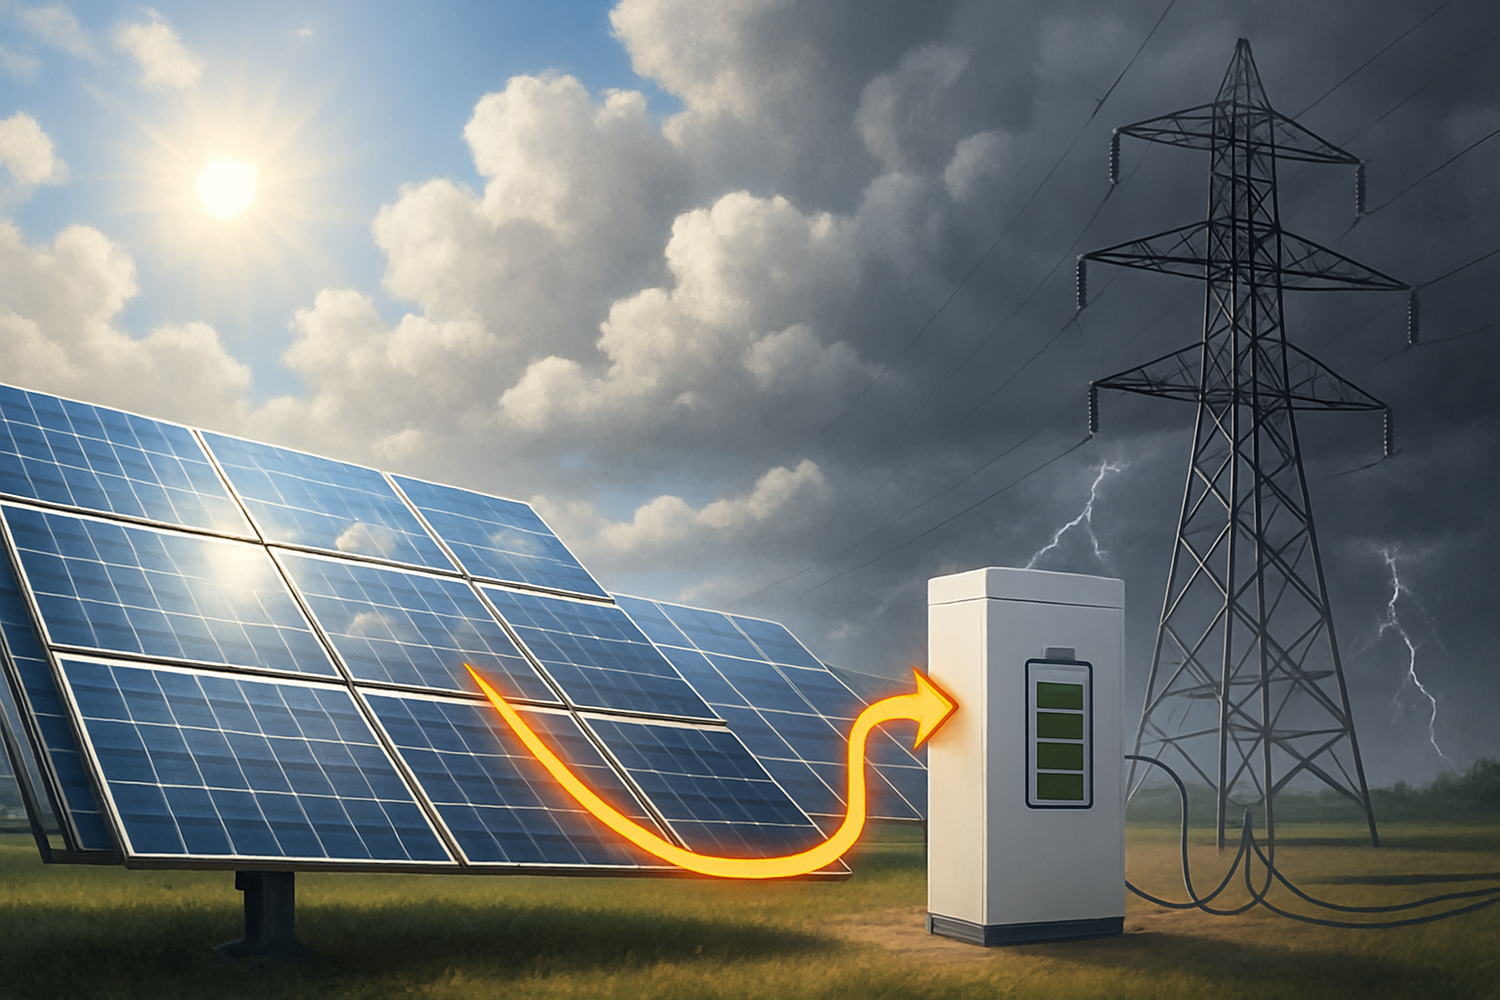
Solar power is clean and scalable, but it is also weather-driven. Grid operators must manage rapid output variations (“PV ramps”) and, at times, deliberately reduce output (“curtailment”) to keep electricity reliable. This guide explains the physics, the grid context, and practical mitigations—anchored in established research and operator data.
Understanding PV Ramps: Weather Moves, PV Follows
PV output is proportional to incident irradiance. When clouds, fog, or smoke change irradiance quickly, plants can ramp down or up within seconds to minutes. At fleet scale, aggregation smooths variability; at plant or feeder scale, ramps can be steep enough to matter for reserves and voltage control. Characterizing ramp distributions and duration (seconds to minutes) is standard practice in integration studies. See NREL’s variability work and multi-site analyses for typical ranges and operator implications. (References at end.)
Weather Drivers
- Cloud fields and edges: Passing cumulus decks create fast down- and up-ramps; “edge-of-cloud” brightenings can cause brief spikes.
- Fog/haze and smoke: Reduce direct beam, raise diffuse share; output drops and becomes more variable.
- Rain and soiling: Heavy rain briefly lowers output but can clean modules and improve later production; dust build-up depresses output until cleaned.
Forecasting & Reserves
Short-term forecasts (sky imagers, satellite nowcasts) and statistical ramp metrics help operators size intra-day reserves and set limits on ramps, improving reliability in variable conditions. Guidance from IEA’s VRE-integration framework and PV integration studies shows how these tools scale with penetration. (References.)

Curtailment: Why Operators Sometimes Reduce Solar Output
Curtailment is an intentional reduction in renewable output to protect system stability or due to economics (for example, very low or negative prices when supply exceeds demand). Common technical drivers include:
- Transmission & distribution constraints: Congestion prevents moving power to load centers.
- Voltage/frequency management: In weak or saturated areas, reducing output keeps limits within bounds.
- Over-generation periods: Mild spring days with high solar and low load are classic curtailment windows.
For context, California’s ISO reported a rise in renewable curtailment, with solar comprising the vast majority in 2024 (3.4 TWh curtailed, +29% year-over-year). Grid congestion and seasonal over-generation were key contributors. (See references.)
Seasonality and Temperature Effects
Seasonal geometry (sun angle, day length) drives predictable changes in PV output, while temperature affects efficiency. Crystalline-silicon module output typically declines by about 0.3–0.5% per °C above 25 °C; hot modules (e.g., 60 °C) can be roughly 10–15% below STC-nameplate power. Cold, sunny weather can improve voltage and efficiency but still depends on irradiance and snow coverage. (References.)
| Cell Temperature | Approx. change vs 25 °C | Notes |
|---|---|---|
| +5 °C (30 °C) | −1.5% to −2.5% | Using −0.3% to −0.5%/°C range |
| +10 °C (35 °C) | −3% to −5% | Heat sinks/air gaps help |
| +20 °C (45 °C) | −6% to −10% | Common on warm roofs |
Mitigations: Turning Variability into Routine Operations
1) Energy Storage Systems
Storage absorbs midday surplus and supports ramps, reducing curtailment and firming evening supply. Costs have fallen and deployments are scaling rapidly, making batteries a frontline tool for variability and reliability. (References.)
2) Grid Modernization
Upgrades to transmission/distribution, congestion relief, and flexible connection models expand headroom where renewables are growing faster than wires. Several European operators are piloting off-peak/flexible contracts and investing heavily to ease constraints. (References.)
3) Advanced Controls & Forecasting
Grid-forming inverter controls (GFM) can actively support voltage/frequency in low-inertia systems, complementing improved meteorological nowcasting and automated curtailment minimization strategies. (References.)
Practical Takeaways
- Use conservative, sourced numbers for temperature coefficients and ramp magnitudes.
- When citing curtailment, anchor to operator data (time, location, driver).
- Frame storage, forecasting, and GFM as complementary—not one-shot fixes.
- Add author credentials, reviewer, last-reviewed date, methods, and references for E-E-A-T.
References (Selected)
- Google Search Central — People-first content & Core updates guidance. Creating helpful content; Core updates; indexing/soft-404/canonicalization docs. Page indexing report, Duplicate URLs, Canonicalization
- NREL — PV variability, ramps, and integration studies. Simulation of PV Variability; Utility-Scale PV Variability Workshop
- IEA — Variable renewables integration frameworks. Renewable Integration (VRE phases); System Integration of Renewables
- Curtailment data — CAISO/EIA. EIA: CAISO curtailed 3.4 TWh in 2024; CAISO daily curtailment report example
- Grid-forming inverters — research & primers. Research Roadmap on GFM Inverters; Introduction to GFM (2024); NREL explainer
- Grid congestion & flexible connections (example). TenneT off-peak flexible contracts


Leave a comment
All comments are moderated before being published.
This site is protected by hCaptcha and the hCaptcha Privacy Policy and Terms of Service apply.