Your home battery system is a significant step toward energy independence. To get the most out of this investment, you need to ensure it operates efficiently and safely for its entire lifespan. Proactive monitoring is the key. By tracking a few simple metrics each week, you can identify potential issues early, optimize performance, and significantly extend the life of your battery. This routine doesn't require deep technical knowledge, just a few minutes with your system's monitoring app.
Foundational Metrics for Battery Health
These first three metrics form the bedrock of battery health. They give you a clear picture of how your battery is being used and how it's aging over time.
State of Charge (SoC) Management
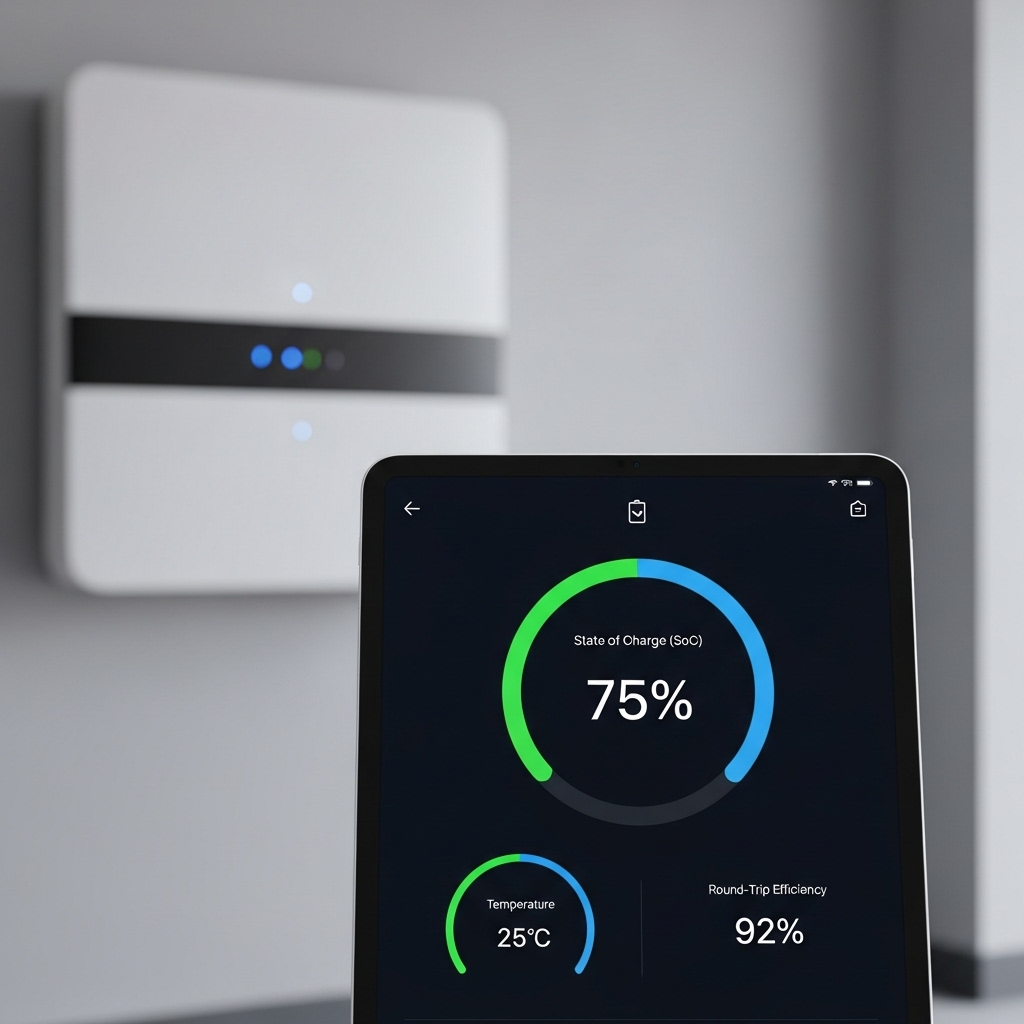
State of Charge, or SoC, is simply your battery's current charge level, expressed as a percentage. Think of it like the fuel gauge in your car. Consistently running your battery completely full or completely empty adds stress to the battery cells. For LiFePO4 (Lithium Iron Phosphate) batteries, maintaining an SoC between 20% and 80% for daily use can help reduce degradation and prolong its useful life. Check your app weekly to see your typical SoC range and adjust your settings if needed.
Depth of Discharge (DoD) Analysis
Depth of Discharge is the inverse of SoC. If your battery has a 20% SoC, its DoD is 80%. Each charge and discharge cycle wears the battery down, and deeper discharges cause more wear. A battery that is regularly discharged to 90% DoD will have a shorter lifespan than one that is typically discharged to 50%. Most modern battery management systems (BMS) allow you to set a maximum DoD. A weekly check ensures your settings are protecting your battery from excessive strain.
Cycle Count Tracking
A cycle represents one full charge and discharge of the battery. Your battery is rated for a specific number of cycles, often in the thousands for LiFePO4 models. Tracking the cycle count helps you gauge the battery's age relative to its expected lifespan. If you notice the cycle count increasing much faster than anticipated, it might indicate that your system's settings could be optimized to rely more on solar power during the day, saving the battery for when it's truly needed.
Performance and Efficiency Indicators
These metrics tell you how well your battery is performing its job. A gradual decline can be normal, but a sudden drop often points to an underlying issue.
Round-Trip Efficiency (RTE)
Round-Trip Efficiency measures how much energy you get out of the battery compared to how much you put in. For example, if you put 10 kWh into the battery and get 9.5 kWh out, its RTE is 95%. High-quality LiFePO4 batteries typically have an RTE above 90%. A weekly glance at this number is crucial. If you see a noticeable decline, it could signify cell degradation or other system inefficiencies. As detailed in the ultimate reference for solar storage performance, maintaining high RTE is fundamental to the economic value of your storage system.
Charge and Discharge Rates (C-Rates)
The C-rate indicates how quickly the battery charges or discharges relative to its total capacity. A 1C rate on a 10 kWh battery means it's charging or discharging at 10 kW. High C-rates generate more heat and put more stress on the battery components. While your system is designed to handle its maximum C-rate, operating at lower rates more frequently is gentler on the battery. Check your app's historical data to see the peak rates your battery experiences.
Safety and Environmental Checks
Safety is paramount. These weekly checks ensure your battery is operating within its designated safe environmental and electrical parameters.
Temperature Monitoring
Temperature is a critical factor for both battery longevity and safety. LiFePO4 batteries are known for their safety, but they still have an optimal operating temperature range, typically between 15°C and 35°C (59°F to 95°F). Your monitoring app should display the battery's internal temperature. A quick weekly check, especially during heatwaves or cold snaps, confirms that the battery's cooling or heating systems are functioning correctly and that it isn't overheating or getting too cold.
Voltage and Current Stability
A healthy battery maintains a stable voltage across its cells. Your battery pack is made of many individual cells working together, and the BMS works to keep them all balanced. Advanced monitoring dashboards may show individual cell voltages. If you notice one cell or a group of cells with a consistently different voltage than the others, it could be an early warning sign of a problem that requires professional attention.
System-Level Health Assessment
Finally, look at how your battery integrates with your entire home energy system. These metrics help you optimize your overall energy strategy.
Self-Consumption Rate
This metric shows you what percentage of the solar energy you generate is used in your home, either directly or from the battery, instead of being exported to the grid. A higher self-consumption rate usually means you're getting more value from your solar-plus-storage system. Monitoring this weekly can help you adjust habits, such as running large appliances during the day, to maximize your energy independence.
System Alerts and Fault Logs
It's easy to ignore system notifications, but they are your system's way of communicating with you. Make it a weekly habit to review the event or fault log in your monitoring app. Look for any recurring warnings or errors, such as communication dropouts or temperature alerts. Addressing these small flags promptly can prevent them from escalating into more significant service issues.
Your Weekly Battery Health Checklist
To simplify the process, here is a summary of the key metrics in a quick-reference table. Use this as your weekly guide to monitor battery performance effectively.
| Metric | What to Check For | Ideal Range / Indication |
|---|---|---|
| State of Charge (SoC) | Typical daily operating range | 20% - 80% for daily use |
| Depth of Discharge (DoD) | Maximum discharge level reached | Consistently below manufacturer's max limit (e.g., <90%) |
| Cycle Count | Rate of increase over the week | Steady and predictable increase |
| Round-Trip Efficiency (RTE) | Stable efficiency percentage | >90% for LiFePO4, no sudden drops |
| C-Rates | Peak charge/discharge power | Within manufacturer's specified limits |
| Temperature | Internal battery temperature | 15°C - 35°C (59°F - 95°F) |
| Voltage/Current | Consistency across cells (if available) | Stable and balanced readings |
| Self-Consumption | Percentage of solar energy used on-site | High and optimized for your usage |
| Alerts & Faults | Review of the system event log | No new, recurring, or critical errors |
Proactive Monitoring for Long-Term Value
Consistently checking these nine metrics is a simple yet powerful routine. It transforms you from a passive owner into an informed manager of your home energy system. This small weekly time commitment helps protect your hardware, maximize your financial returns, and ensure safe, reliable operation for years. The growing adoption of home batteries is a testament to their value. As noted by the IEA's report on Clean Energy Innovation, the modularity of battery applications is a key attribute driving their success. By taking these steps, you are actively preserving the value of that innovative technology right in your home. This proactive approach is the best way to secure your energy independence and get the most from your solar and storage system.
Frequently Asked Questions
What is the ideal State of Charge to leave a home battery at for long-term storage?
If you plan to not use your battery for an extended period (e.g., several weeks), it is generally recommended to leave it at a State of Charge between 40% and 60%. This neutral state minimizes stress on the battery cells. Always consult your manufacturer's specific guidelines for long-term storage.
How often should I perform a full battery calibration?
Most modern home batteries with advanced Battery Management Systems (BMS) do not require frequent manual calibration. The BMS constantly learns and adjusts its SoC readings. A full cycle (from 100% down to the minimum DoD and back up) might be recommended by the installer or manufacturer once or twice a year to ensure the SoC reading remains accurate, but it's not a weekly task.
Can I monitor my battery remotely?
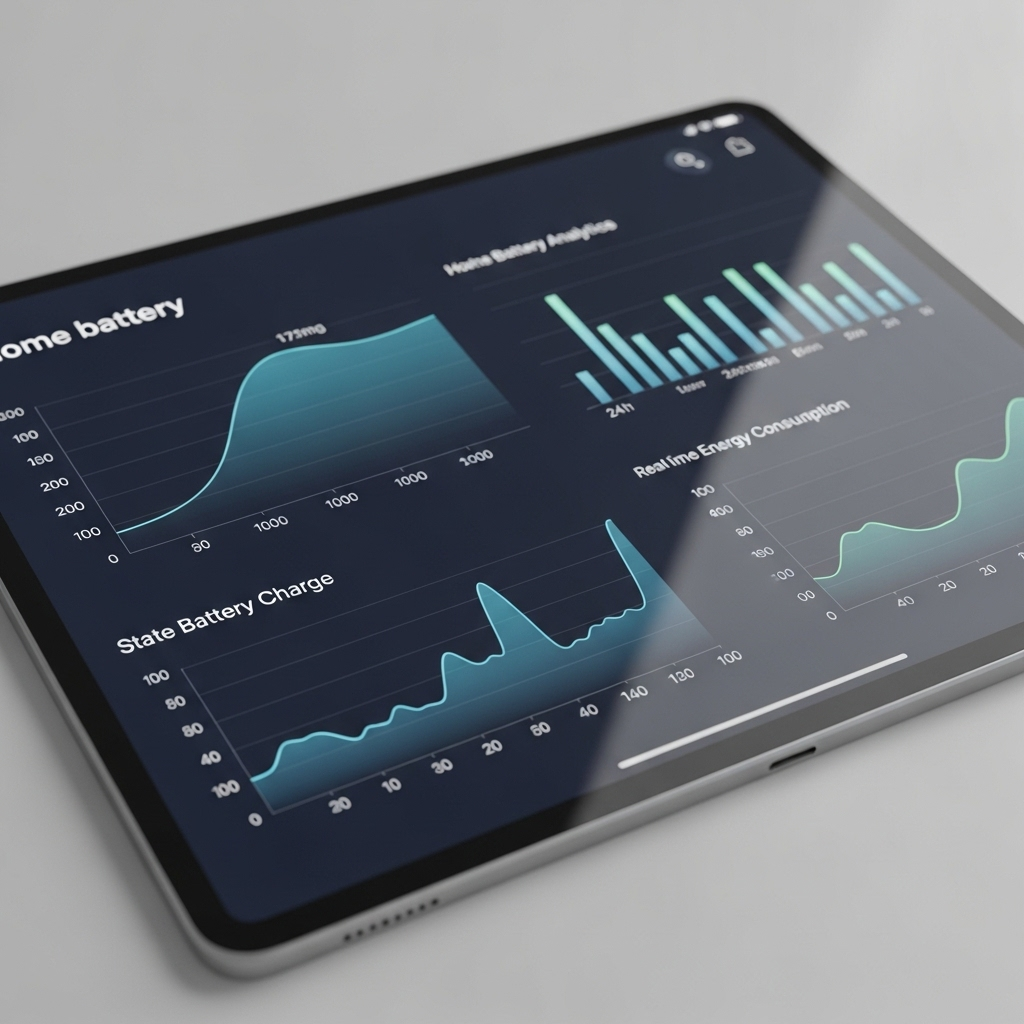
Yes, nearly all modern home battery systems come with a cloud-based monitoring platform accessible via a smartphone app or web portal. This allows you to check all the key metrics discussed, review historical data, and receive system alerts from anywhere with an internet connection.
What does a sudden drop in round-trip efficiency indicate?
A sudden, significant drop in RTE is a red flag. It could indicate a problem with one or more battery cells, a malfunction in the inverter, or an issue with the system's wiring or connections. If you observe this, it is best to contact your installer for a professional diagnosis to prevent further damage or safety issues.


Leave a comment
All comments are moderated before being published.
This site is protected by hCaptcha and the hCaptcha Privacy Policy and Terms of Service apply.