For any off-grid solar project, the ultimate goal is reliable power. But what does 'reliable' truly signify? It means having confidence that your system will deliver the energy you need, year after year. This confidence is what makes a project 'bankable'—not just for financiers, but for anyone investing in their energy independence. The key to achieving this is moving beyond simple averages and embracing a statistical approach using P-metrics. This article provides a clear roadmap for transitioning from a basic P50 estimate to a robust, bankable P95 projection, ensuring your off-grid system is built on a foundation of certainty.
Understanding the P-Metrics: A Spectrum of Confidence
P-metrics, or exceedance probabilities, are a statistical language used to describe the certainty of an energy yield forecast. They quantify risk and allow you to design a system that aligns with your specific reliability needs.
What is P50? The Average Expectation
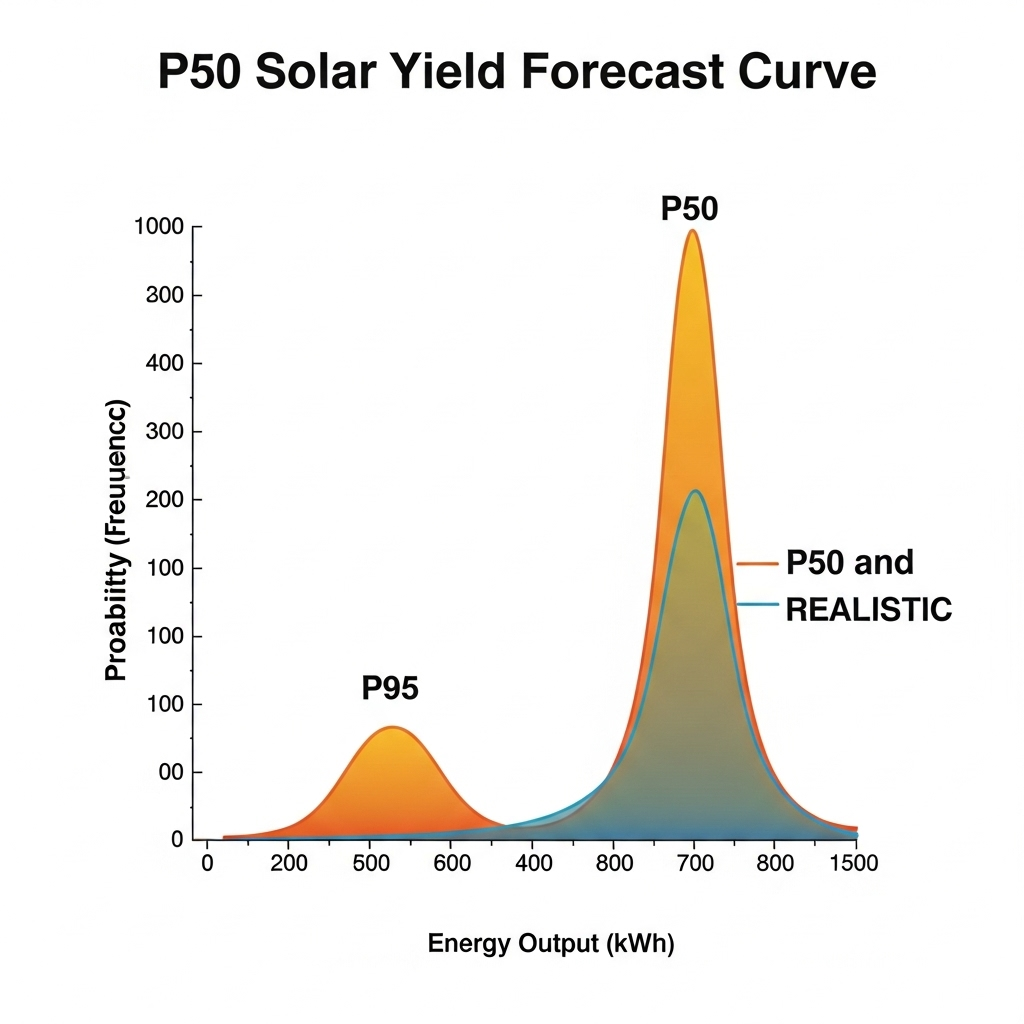
A P50 forecast represents the median estimate of energy production. This means there is a 50% probability that the actual energy yield in a given year will be higher than the forecast, and a 50% chance it will be lower. While useful for initial project assessments or non-critical applications, relying solely on a P50 value is a gamble. It represents an average year, failing to account for seasons with lower-than-average sunshine or unexpected system performance issues.
Moving Beyond the Average: P75, P90, and P95
Higher P-values represent greater confidence. A P90 forecast, for instance, indicates a 90% probability that the actual annual energy production will meet or exceed the projected amount. A P95 forecast increases that confidence level to 95%. These are the metrics used for bankability and mission-critical power systems. They account for the inherent variability of solar resources and provide a conservative, high-confidence baseline for what your system will produce, even in a poor-weather year.
Why Bankability Hinges on P95
For investors, lenders, or homeowners who depend on their off-grid system for daily life, P95 is the gold standard. It demonstrates that the project's risks have been thoroughly analyzed and mitigated. According to the International Energy Agency's report, Getting Wind and Solar onto the Grid, ensuring 'investment certainty' is crucial for attracting financing. A P95 forecast provides this certainty. It transforms an energy prediction from a hopeful estimate into a dependable performance guarantee, ensuring energy security for remote residences, agricultural operations, and commercial facilities.
The Four Pillars of a High-Confidence Yield Forecast
Achieving a bankable P95 yield forecast requires a meticulous and multi-faceted approach. It rests on four key pillars that move your analysis from a rough guess to a precise calculation.
Pillar 1: High-Fidelity Weather and Irradiance Data
The foundation of any yield forecast is weather data. While free, generic data can provide a P50 baseline, a P95 forecast demands higher quality. This involves using long-term (20+ years) satellite or ground-station data specific to your project's location. This detailed data allows for an analysis of inter-annual variability—the natural fluctuations in solar radiation from one year to the next. As highlighted in the IEA's Medium-Term Renewable Energy Market Report 2016, stable policy and planning frameworks rely on predictable inputs, and high-quality data is the most fundamental input for solar projects.
Pillar 2: Detailed System Loss Modeling
Energy generated by your solar panels never fully reaches your appliances. A series of losses occur along the way. A P50 estimate might use a generic loss factor, but a P95 analysis requires a granular breakdown of each potential loss. This includes soiling (dust, snow), shading from obstacles, temperature-based efficiency reductions (derating), DC and AC wiring resistance, and inverter inefficiency.
| Loss Factor | Typical P50 Assumption | Conservative P95 Assumption |
|---|---|---|
| Soiling Loss | 2% | 3-5% (site-specific) |
| Shading Loss | 0-1% (if assumed open) | Detailed 3D analysis |
| Temperature Derating | 8% | 10-12% (based on local climate) |
| Component Mismatch | 1% | 1.5-2% |
| Inverter & Wiring Loss | 4% | 5-6% (based on specific components) |
Pillar 3: Accounting for Component Degradation
Solar panels and batteries degrade over time, producing less energy as they age. A bankable forecast must account for this decline over the project's entire lifespan. For solar panels, this means using the manufacturer's specific degradation warranty rather than a generic value. For energy storage, the choice of technology is critical. LiFePO4 (Lithium Iron Phosphate) batteries offer superior long-term performance with lower degradation rates and a higher cycle life compared to older chemistries. Understanding the relationship between Depth of Discharge (DoD), operating temperature, and cycle life is essential for an accurate 20-year forecast. A comprehensive guide on solar storage performance shows how these factors directly influence the usable capacity of your battery bank over time, which is a key input for a reliable yield model.
Pillar 4: Probabilistic Forecasting Methods
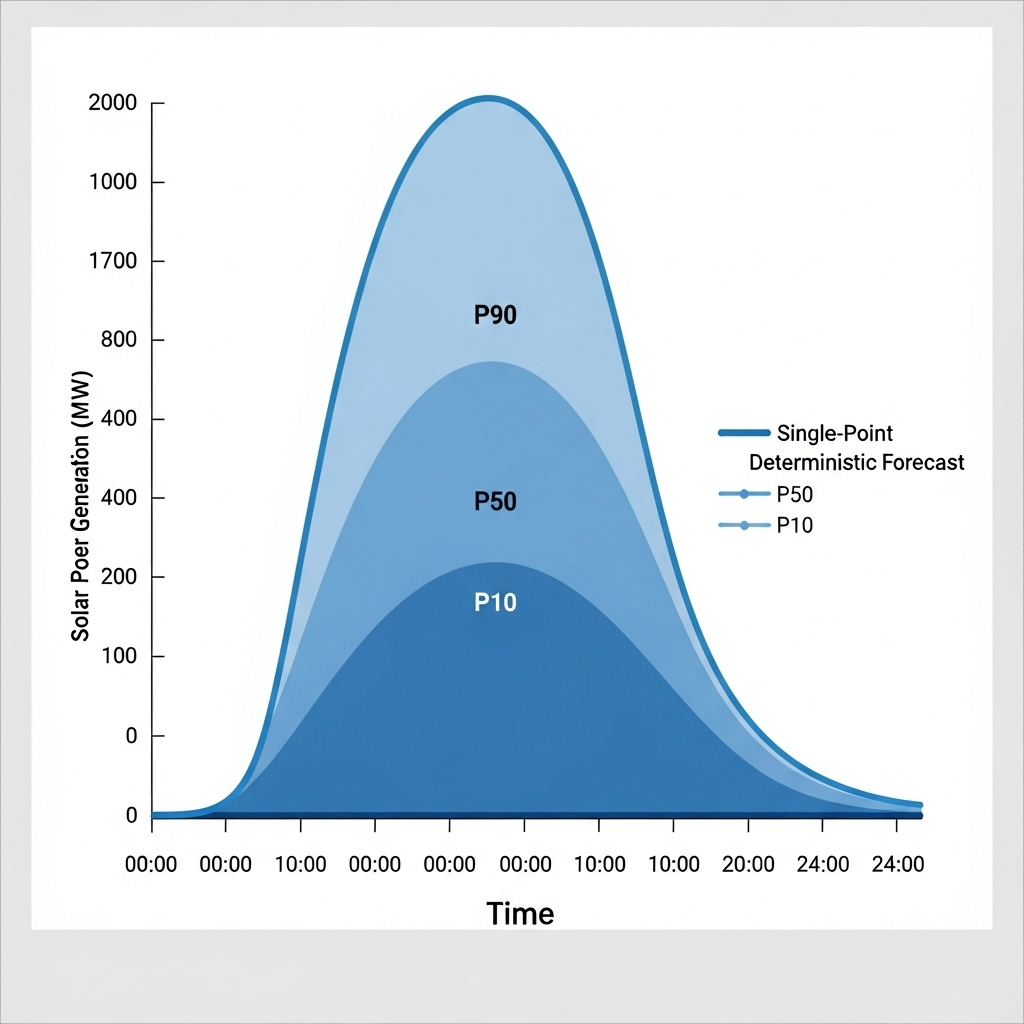
Finally, a P95 forecast brings all these variables and uncertainties together using probabilistic methods. Instead of calculating a single deterministic outcome, specialized software runs thousands of simulations (a technique known as a Monte Carlo analysis). Each simulation uses slightly different values for weather, soiling, degradation, and other factors based on their individual probability distributions. The result is not one number, but a full spectrum of possible annual yields, from which the P95, P90, and P50 values can be identified.
From Theory to Practice: Building a Bankable Off-Grid System
Understanding P-metrics is the first step. Applying them to your system design is where reliability is truly built. This involves sizing components for high confidence and recognizing the central role of energy storage.
Sizing for P95, Not P50
The practical consequence of designing for P95 is a more robust system. A P95-compliant system will almost always require a larger solar array and/or a larger battery bank compared to one sized using a P50 forecast. While a P50 design might meet your energy needs in an average year, a P95 design is engineered to meet your needs 19 out of 20 years, even during periods of low sunlight. This upfront investment in additional capacity is the premium paid for long-term energy security.
The Critical Role of Energy Storage
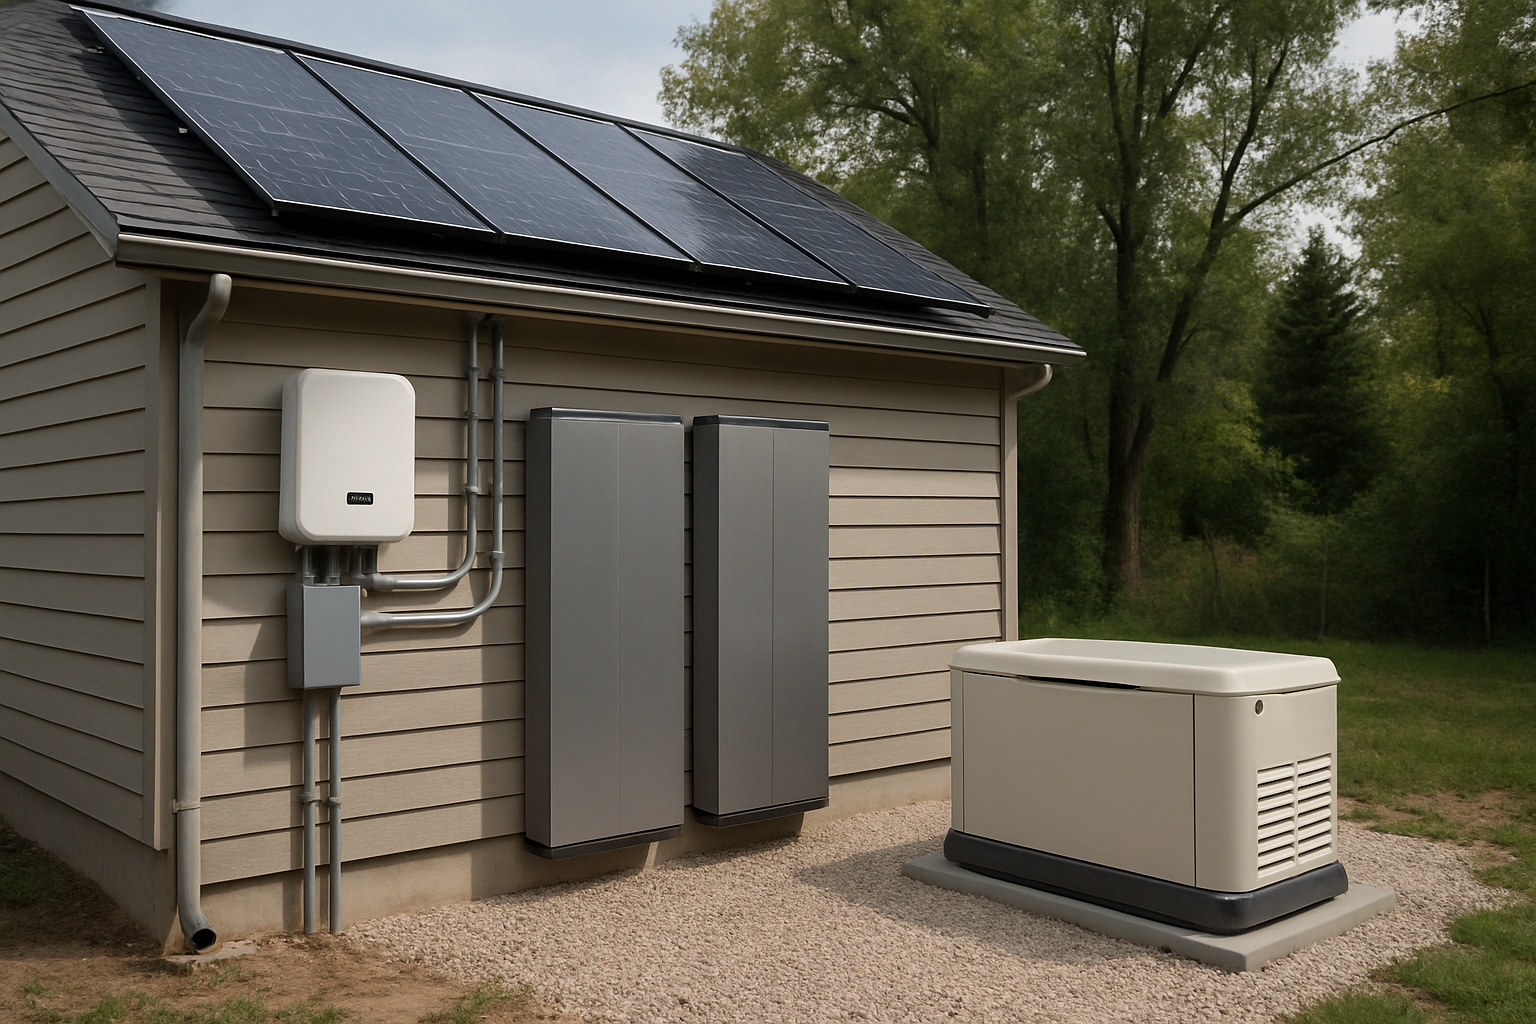
A high-confidence yield forecast is only valuable if you can capture and use that energy when you need it. An energy storage system (ESS), particularly one using high-performance LiFePO4 batteries, is the component that bridges the gap between intermittent generation and consistent demand. It smooths out the daily and seasonal fluctuations identified in the P95 analysis. The IEA's report on System Integration of Renewables emphasizes that new sources of flexibility, like storage, are key to managing variable renewables. A properly sized ESS ensures that your *usable* energy meets the P95 promise, providing power through cloudy days and after sunset.
The Long-Term View: Securing Your Investment
The path from a P50 guess to a P95 certainty is a journey from ambiguity to confidence. It involves a deeper level of analysis, a commitment to quality components, and a design philosophy centered on resilience. While a P95-driven approach may require a greater initial investment, it fundamentally de-risks your project. It protects against power shortfalls, ensures system performance aligns with expectations, and secures the long-term value of your investment in energy independence. Ultimately, a bankable yield is not just about the numbers; it is about the peace of mind that comes from knowing your power will be there when you need it most.
Disclaimer: The information in this article is for educational purposes only and does not constitute financial or investment advice. Consult with a qualified professional for project-specific analysis.
Frequently Asked Questions
Is a P50 forecast ever useful?
Yes, P50 is a good starting point for initial feasibility studies or non-critical applications where occasional power shortfalls are acceptable. It provides a quick estimate of average production potential.
How much more does a P95-designed system cost?
The cost increase varies but can range from 10% to 30% or more. This is due to the larger solar array and/or battery capacity needed to guarantee power during less-than-ideal conditions. The additional cost should be weighed against the value of energy security and reliability.
Can I calculate P90 or P95 myself?
A basic estimation is possible, but a true bankable P95 calculation requires specialized software, high-quality long-term weather data, and expertise in modeling system losses and uncertainties. It is often performed by professional solar engineers.
Does the type of battery affect the P-value calculation?
Absolutely. The battery's efficiency, degradation rate, and usable capacity under different temperatures are key inputs. High-performance LiFePO4 batteries have more predictable and stable long-term performance, which reduces uncertainty and contributes to a more reliable P95 forecast.


Leave a comment
All comments are moderated before being published.
This site is protected by hCaptcha and the hCaptcha Privacy Policy and Terms of Service apply.