Building an off-grid cabin is an investment in self-sufficiency. A key part of that investment is designing a solar microgrid that delivers reliable power. Yet, forecasting future solar energy production is filled with uncertainty. This case study examines the practical differences between P50 and P90 solar yield projections for a cabin microgrid. You will see how choosing one over the other directly impacts system reliability, cost, and your long-term energy independence.
Understanding P50 and P90 Solar Yield Projections
Solar energy forecasting relies on probability. P50 and P90 are statistical metrics that help you understand the likelihood of your system producing a certain amount of energy. The choice between them reflects your tolerance for risk.
What is a P50 Projection?
A P50 projection represents a median estimate. It signifies that there is a 50% probability your solar system will produce at least the forecasted amount of energy in a given year. Think of it as the 'most likely' or 'average' scenario. This model is often sufficient for grid-connected systems, where any shortfall can be easily covered by pulling power from the utility. For an off-grid setup, relying solely on a P50 estimate can be optimistic.
What is a P90 Projection?
A P90 projection is a more conservative and cautious estimate. It means there is a 90% probability that your system's energy production will meet or exceed the forecasted amount. This high-confidence forecast accounts for years with lower-than-average sunlight, such as those with extended cloudy periods or heavy snowfall. For a mission-critical application like a cabin microgrid, a P90 forecast provides a much stronger assurance of energy availability.
Why the Difference Matters for Off-Grid Systems
The distinction between P50 and P90 is critical for off-grid living. A production shortfall in a grid-tied home is a minor inconvenience that might slightly increase an electricity bill. For an off-grid cabin, a shortfall could mean a complete loss of power. This impacts everything from refrigeration and water pumping to basic lighting. Therefore, planning with a P90 mindset is a strategy for resilience, ensuring your system can handle less-than-ideal weather conditions without failure.
The Cabin Microgrid Case Study: System Setup
To illustrate the impact of P50 versus P90 planning, we will use a realistic case study of a remote cabin located in a region with significant weather variability.
The Location and Load Profile
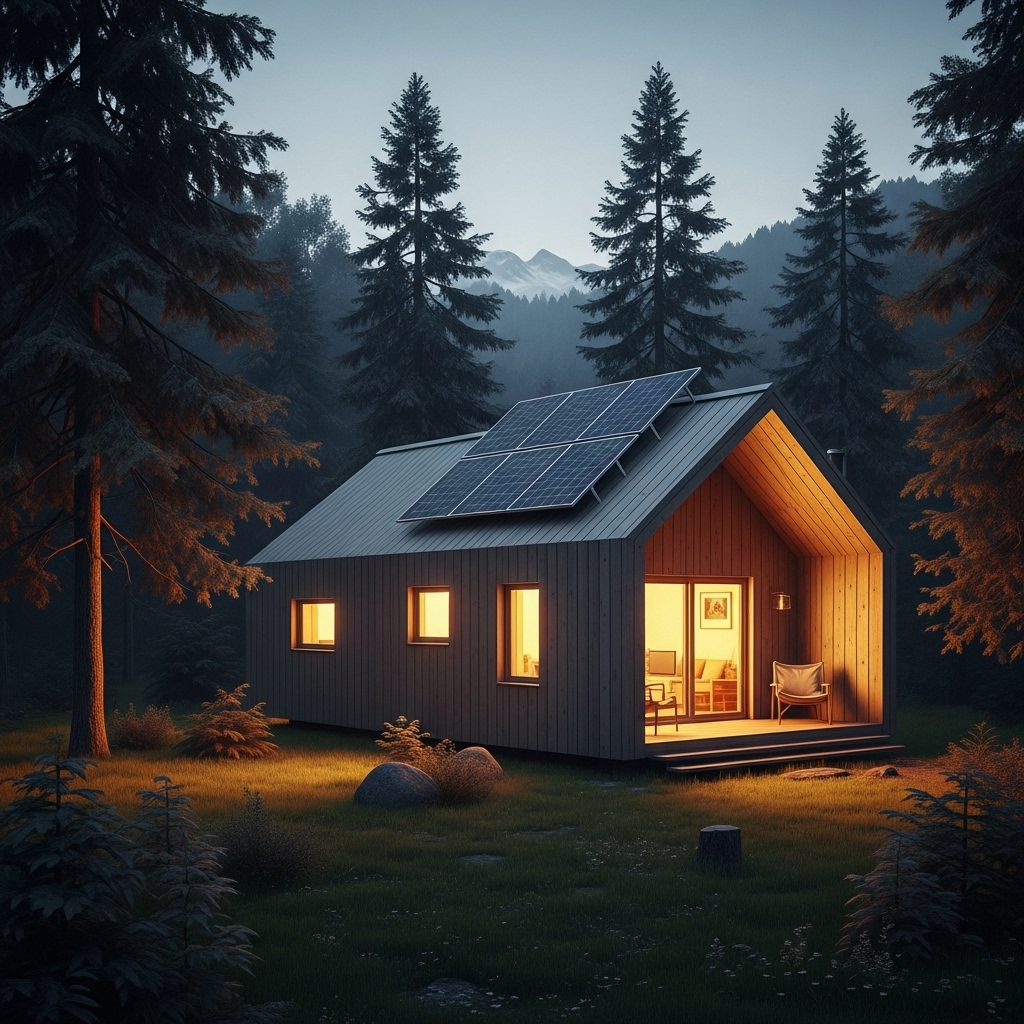
Our hypothetical cabin is situated in a mountainous area, experiencing sunny summers but also long, overcast winters. The daily energy requirement, or load, is calculated to be approximately 5 kWh. This powers essential appliances: LED lighting, a small high-efficiency refrigerator, a water pump, and charging for personal electronics. This modest load is typical for a well-planned, energy-conscious off-grid home.
The System Components
The microgrid is designed with modern, reliable components to maximize efficiency and longevity. The core hardware includes:
- Solar Array: A 3 kW array of high-efficiency solar panels.
- Energy Storage: A 10 kWh LiFePO4 (Lithium Iron Phosphate) battery bank. This chemistry is chosen for its superior safety, long cycle life, and high efficiency.
- Inverter: A 5 kW hybrid inverter, which manages power flow between the solar panels, battery, and a small backup generator.
Comparing P50 and P90 Energy Yield Outcomes
Using the same 3 kW system, we now model its performance against both P50 (average year) and P90 (low-sunlight year) weather data. The results reveal a significant gap in reliability.
The P50 Scenario: 'The Average Year'
In a P50 scenario, the 3 kW system performs well. It consistently meets the cabin's 5 kWh daily load from spring through autumn. During peak summer months, it generates surplus energy that keeps the battery fully charged. In winter, there might be a few days requiring brief energy conservation, but the system remains largely self-sufficient. Reliance on the backup generator is minimal, perhaps only a few hours during the deepest part of winter.
The P90 Scenario: 'The Low-Sunlight Year'
When we apply P90 data, the picture changes. This scenario simulates a year with more cloudy days and lower solar irradiance. The same 3 kW system now struggles to meet the 5 kWh daily load during winter and even parts of the spring and fall. The battery's state of charge frequently drops to low levels, triggering the need for the backup generator far more often. This leads to increased fuel costs, generator maintenance, and the disruption of a quiet, off-grid life.
Data-Driven Comparison
The trade-offs become clear when we compare the performance of a system sized for P50 needs versus one designed to meet a P90 production target.
| Metric | System Sized for P50 Target | System Sized for P90 Target |
|---|---|---|
| System Design | 3 kW Solar / 10 kWh Battery | 4 kW Solar / 15 kWh Battery |
| P90 Annual Solar Generation | ~3,300 kWh | ~4,400 kWh |
| Estimated Days of Energy Shortfall (in a P90 year) | 30-45 days | 0-5 days |
| Estimated Backup Generator Runtime | ~100 hours/year | <10 hours/year |
| Relative Upfront System Cost | Base | +25-35% |
Disclaimer: These figures are illustrative estimates for this case study. Actual performance and costs will vary based on specific location, equipment, and usage patterns.
Implications for System Sizing and Investment
The data shows that designing for P90 requires a larger upfront investment but delivers far greater energy security. This choice has long-term financial and practical consequences.
Sizing for Reliability: The P90 Approach
To reliably meet demand in a P90 year, the system must be oversized relative to a P50 design. In our case study, this means increasing the solar array to 4 kW and the battery bank to 15 kWh. This additional capacity acts as 'energy insurance,' drastically reducing the risk of power outages. As the U.S. Department of Energy's research on power optimization technology shows, advanced components and smart controls can further enhance system output, making the P90 goal more achievable and efficient.
The Cost of Under-Sizing
Opting for a smaller, P50-sized system to save on initial costs can lead to higher long-term expenses. These 'hidden' costs include generator fuel, increased engine wear and tear, and the priceless inconvenience of running out of power. Furthermore, all systems face degradation over time. For a deeper analysis of how different components affect long-term output, reviewing data on solar storage performance provides valuable context on maintaining system efficiency over its lifespan. A P90 design inherently builds a buffer against this inevitable performance decline.
Finding the Right Balance for Your Microgrid
The decision is not a rigid choice between P50 and P90. It is a calculated assessment of your personal risk tolerance and priorities. Some may opt for a P80 design, finding a middle ground between cost and security. The International Energy Agency highlights in its The Power of Transformation report that integrating variable renewables requires flexible resources. In a cabin microgrid, your battery and backup generator provide that flexibility. A well-designed system harmonizes these components to ensure power is always available.
Final Thoughts on Planning for Certainty
P50 projections offer a useful baseline for understanding potential solar generation. However, for the demands of off-grid independence, a P90 forecast provides a much more realistic and secure foundation for system design. Building a cabin microgrid is about creating a resilient and self-reliant power source. By investing in a system designed with conservative, high-confidence data, you ensure your cabin remains a powered sanctuary, regardless of the weather. As noted in the IEA's Next Generation Wind and Solar Power analysis, accounting for variability is key to the success of renewable energy systems, a principle that applies just as much to a small cabin as it does to a national grid.
Frequently Asked Questions
What exactly is a cabin microgrid?
A cabin microgrid is a small, self-contained power system designed to provide electricity to a remote or off-grid cabin. It typically includes solar panels for generation, a battery system (like LiFePO4) for energy storage, and an inverter to convert DC power to usable AC power. It operates independently of the main electrical grid.
Can I use a P50 estimate if I have a backup generator?
Yes, you can. A P50 design coupled with a reliable backup generator is a common strategy. This approach lowers the initial solar and battery investment. However, you must account for the ongoing costs and maintenance of the generator, including fuel consumption, noise, and emissions.
How much more does a P90-designed system cost?
The cost increase for a P90 design depends on the specific location and load. It might require 15-25% more solar panel capacity and/or battery storage compared to a P50 design. While the upfront cost is higher, it often reduces long-term operational costs and improves energy security, providing a better return on peace of mind.
Do P50 and P90 estimates account for equipment degradation?
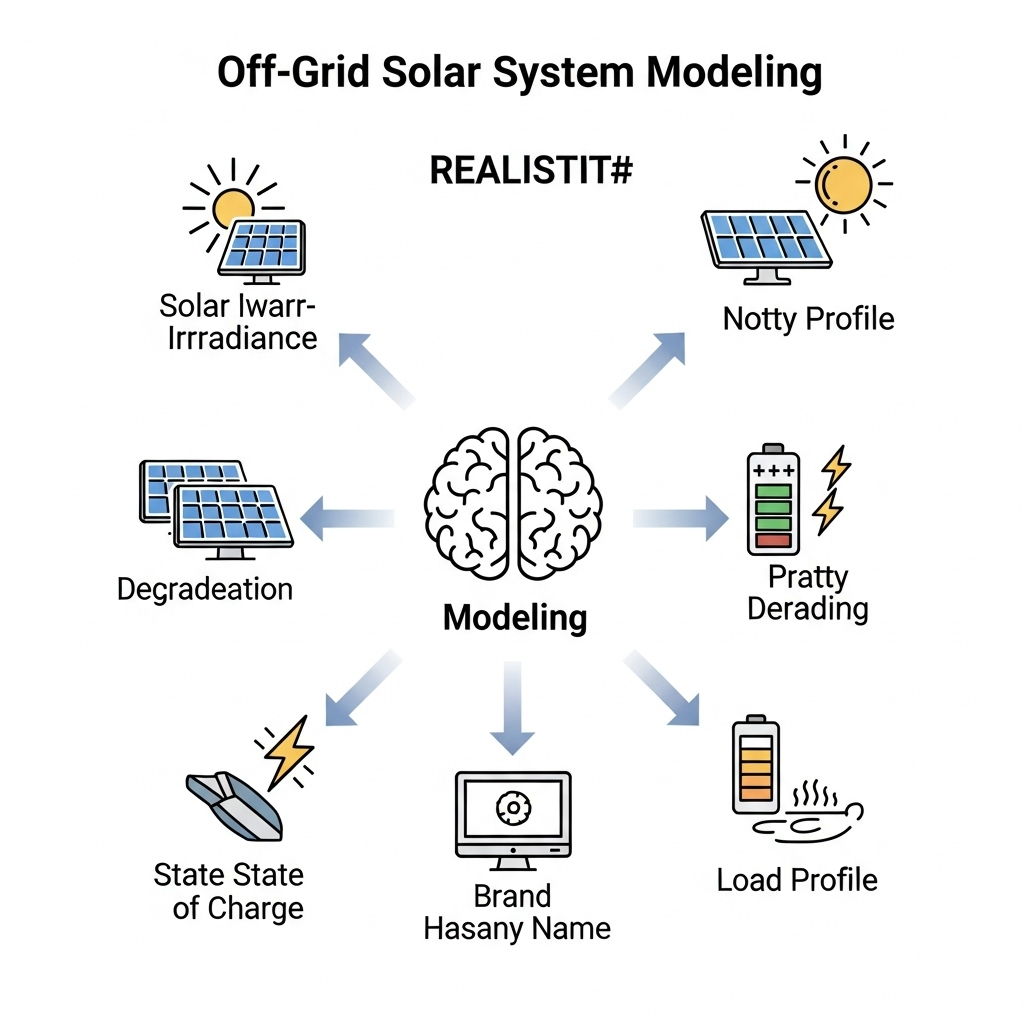
Standard P50/P90 weather data does not inherently include equipment degradation. You must apply separate degradation factors for solar panels (typically 0.5% per year) and battery capacity fade when performing a proper long-term yield analysis. A conservative P90 forecast combined with degradation modeling provides the most robust plan.


Leave a comment
All comments are moderated before being published.
This site is protected by hCaptcha and the hCaptcha Privacy Policy and Terms of Service apply.