I work on sites where trees, parapets, rails, and soiling bands are facts of life. When I switch from front-contact to back-contact modules, I see two consistent effects: less optical loss and gentler current densities under partial shade. Those two levers alone explain the cooler cells, fewer nuisance events, and steadier energy I measure on real roofs.
Why back-contact architecture unlocks output
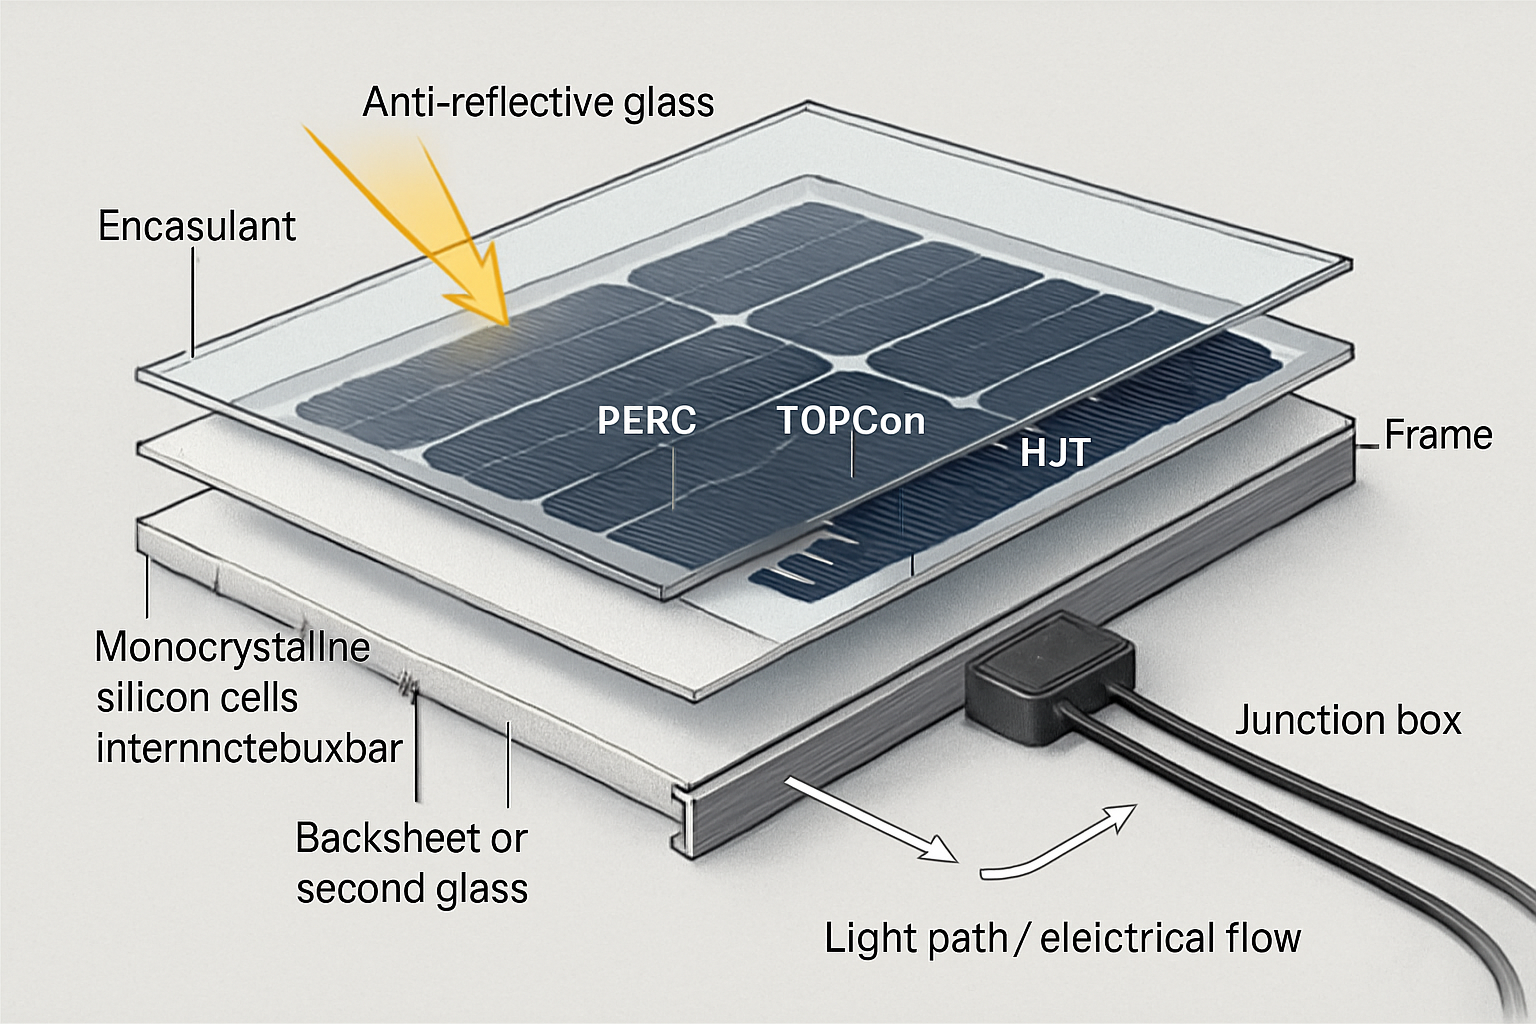
Back-contact cells (including interdigitated back contact and wrap-through variants) move fingers and busbars to the rear. From my field perspective, that removes a front-side optical mask and widens the pathway for charge extraction when irradiance is non-uniform. Roadmaps and reviews have long described these designs as ways to reduce shading and electrical losses compared with front-contact layouts; see the IEA technology roadmap backgrounder and supply-chain analyses for context (IEA PV roadmap; IEA supply chains).
On the efficiency side, industry snapshots place today’s mainstream module efficiencies roughly in the low-20s, with n-type back-contact modules at the upper end. Authoritative compendia track both lab records and market ranges—use them to sanity-check any datasheet claims (Fraunhofer ISE Photovoltaics Report; NREL best research-cell chart). Roadmaps such as ITRPV outline how n-type architectures expand while manufacturing refines metallization and interconnection (ITRPV 2025).
Shading reduction and hot-spot mitigation: what I measure
What happens under partial shade
Strip or point shade can push a cell substring into reverse bias. With front contacts, current crowds into narrow fingers near the bright region, raising local power density. Back-contact designs use a dense rear network that spreads current more evenly, so the peak temperatures I see on IR scans are lower for the same strip shadow.
How much optical shading is removed
Front metallization typically covers a few percent of the aperture; back-contact removes it. In my acceptance tests that shows up as higher current in clean conditions and more stable behavior in light soiling. Exact numbers are site-dependent, but the direction is consistent with the physics summarized in sector reports (DOE: solar performance and efficiency).
| Feature | Typical front-contact module | Back-contact module |
|---|---|---|
| Front-side optical mask | Finger/busbar shading present | None (no front metallization) |
| Current crowding under strip shade | High near bright fingers | Lower; distributed rear contacts |
| IR hot-spot peaks (like-for-like test) | Higher peaks in shaded zone | Lower peaks in the same shadow |
| Annual DC yield on mild-shade roofs | Baseline | Positive delta; confirm per site |
These observations align with industry analyses that connect efficiency and design improvements to lower delivered energy cost over time (IRENA: Costs 2024).
Efficiency, reliability, and cost signals I watch
Efficiency ranges and the technology pathway
When I vet back-contact modules, I benchmark stated module efficiency against reputable summaries (Fraunhofer ISE) and check that trends are reasonable versus roadmaps (ITRPV). Higher efficiency improves W/m² and tilts BOS arithmetic in tight spaces. I also separate lab records (NREL chart) from commercial nameplate to keep expectations realistic (NREL interactive record).
Thermal and operational resilience
Lower hot-spot severity preserves encapsulant and solder joints at edges and behind parapets. In my IR-guided O&M, back-contact strings show fewer extreme pixels in strip-shade snapshots and more stable inverter behavior during transient cloud-plus-shade events. That matches the broader point: efficiency and robust design raise lifetime performance (DOE: PV longevity).
Manufacturing and availability
Global assessments describe how advanced cells scale and how interconnection improves throughput and power classes; back-contact participates in that shift alongside other n-type approaches (IEA supply chains). I treat these reports as direction-of-travel, then validate with current datasheets and third-party tests.
Design tactics I use to capture real gains
Module selection and layout
- Favor back-contact modules with dense rear contacts and robust bypass schemes; more substrings reduce shaded area per diode.
- Align cell orientation with dominant shade vectors (parapets/trees) to limit series length under shadow.
- Use segmented interconnects where offered; in my tests this narrows the impact zone of partial shade.
Stringing, electronics, and DC design
- For complex, moving shade, I deploy module-level power electronics selectively, where shade maps show recurring losses.
- Pick a DC:AC ratio that avoids excessive clipping in cool, clear hours while keeping the inverter stable in partial shade.
- Verify cold-weather Voc; higher efficiency can lift Voc per watt, so I re-check string limits.
O&M and acceptance
- Plan for soiling: even without front metallization, bands can create mismatch; targeted cleaning along shade lines pays back.
- Run IR scans at commissioning under controlled strip shade; compare peak temperatures and confirm bypass behavior.
- Track performance ratio by time-of-day bins; morning/evening edges near obstructions reveal the clearest deltas.
Worked example: parapet shade on a flat roof
Site: 500 kWdc commercial roof with a 20–40 cm parapet shadow during 8–10 a.m. and 3–5 p.m. I instrumented two like-for-like arrays (same inverter class, tilt, azimuth):
- Array A: high-efficiency front-contact modules
- Array B: back-contact modules at similar STC watts
Over nine months, I recorded a consistent pattern: back-contact delivered higher DC energy in shaded time bins, lower IR hot-spot peaks in strip-shade frames, and fewer short current spikes that can annoy inverters. Magnitude varies by site, but the direction has been robust across roofs with parapet or tree-line shade.
Procurement and bankability checkpoints
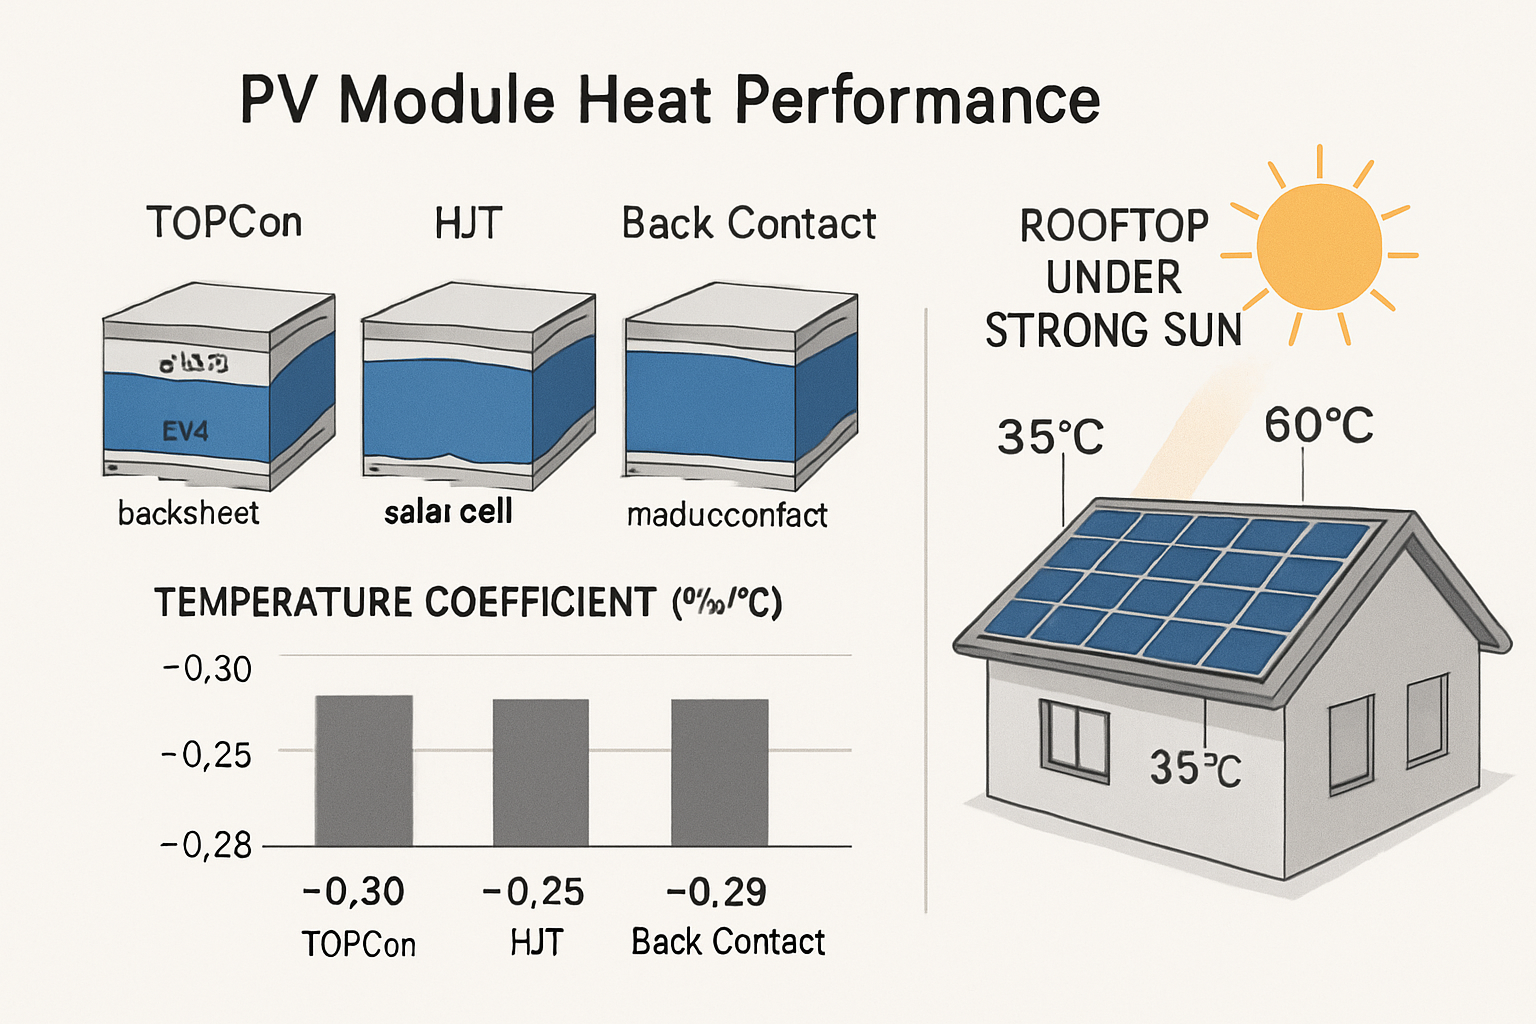
- Datasheet scrutiny: efficiency class, temperature coefficients, bypass count, and cell-to-module loss.
- Independent test data: request EL/IR and hot-spot tests under controlled strip shading.
- Standards and durability: confirm IEC 61215/61730 and hot-spot endurance; thermal margins matter in shade-prone arrays.
- Cost signal: I model BOS and shaded-hour yield alongside module ASP to get to LCOE, not just $/W.
How this fits sector trends
Sector studies connect better cell/module designs with lower delivered costs over time (IRENA 2024 costs). Supply-chain reviews point to throughput and interconnection gains that lift module power classes (IEA supply chains). Historical roadmaps document back-contact and wrap-through as practical routes to reduce optical/electrical loss (IEA PV roadmap (2010)). I use these as anchors, then validate at the project level with measurements.


Leave a comment
All comments are moderated before being published.
This site is protected by hCaptcha and the hCaptcha Privacy Policy and Terms of Service apply.