High temperatures shave watts from PV arrays. The key metric is the temperature coefficient of power. This piece compares heat performance for TOPCon, HJT, and Back Contact cells, and turns the numbers into clear yield and design decisions.
Context matters. Cell physics sets the starting point. Mounting, airflow, and string design amplify or limit losses. You will see how to quantify that impact and choose the right module for hot sites.
What heat does to silicon cells
As cell temperature rises, voltage drops faster than current rises. DC power falls. Manufacturers publish a Pmax temperature coefficient (typically −0.24% to −0.32% per °C from 25°C). Lower magnitude is better.
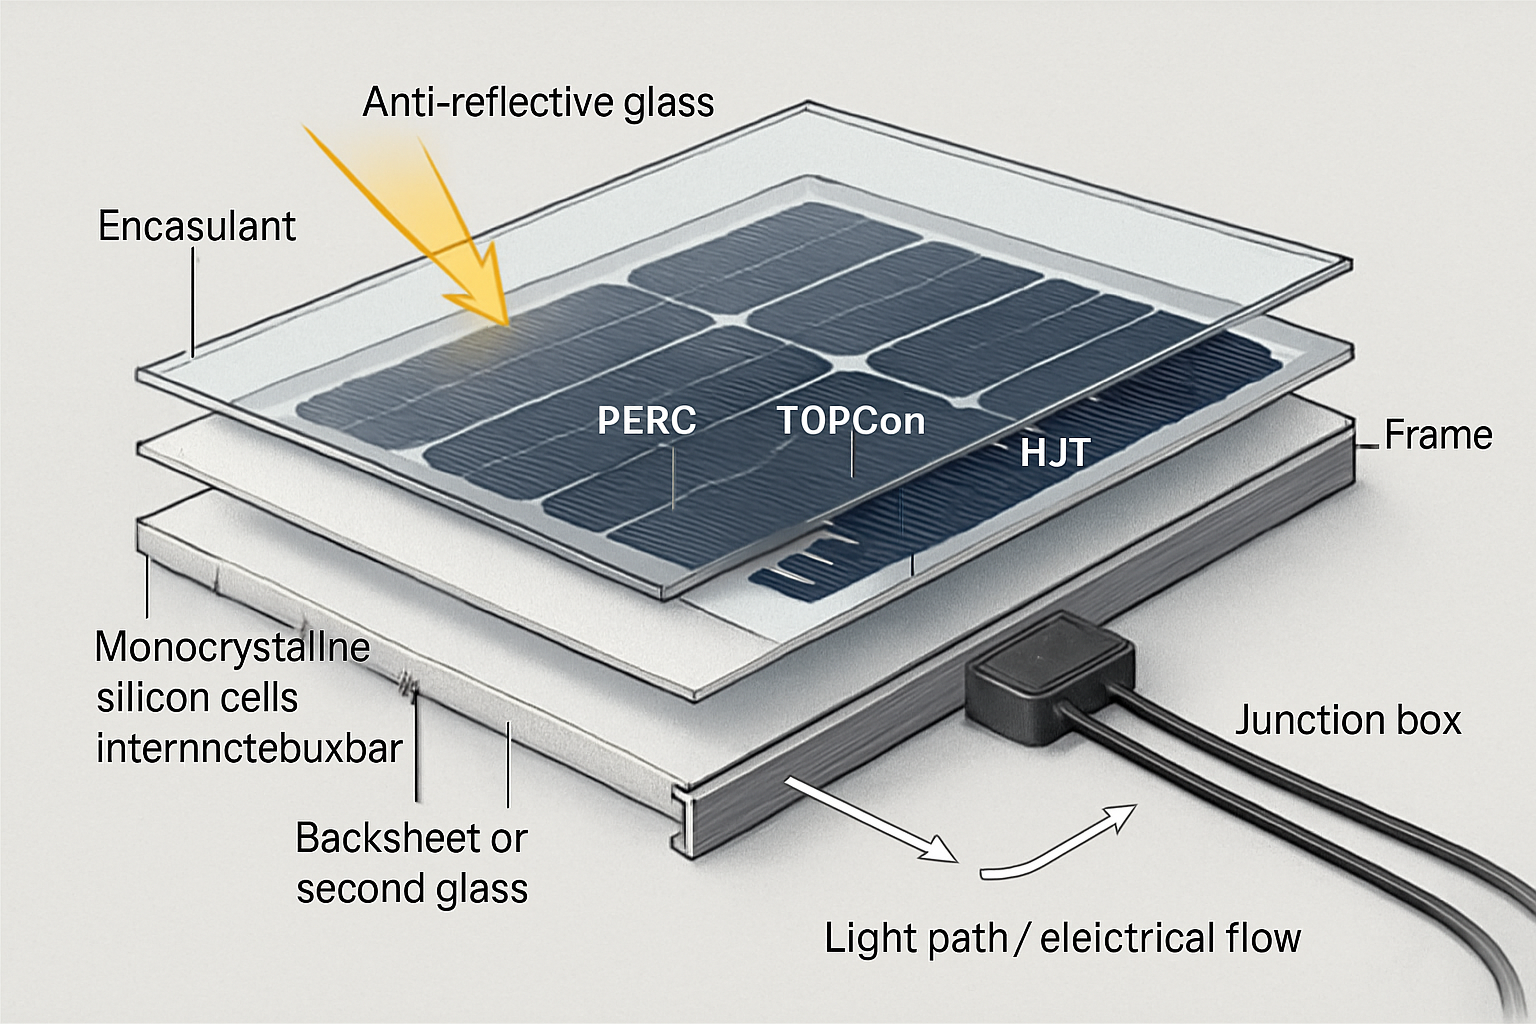
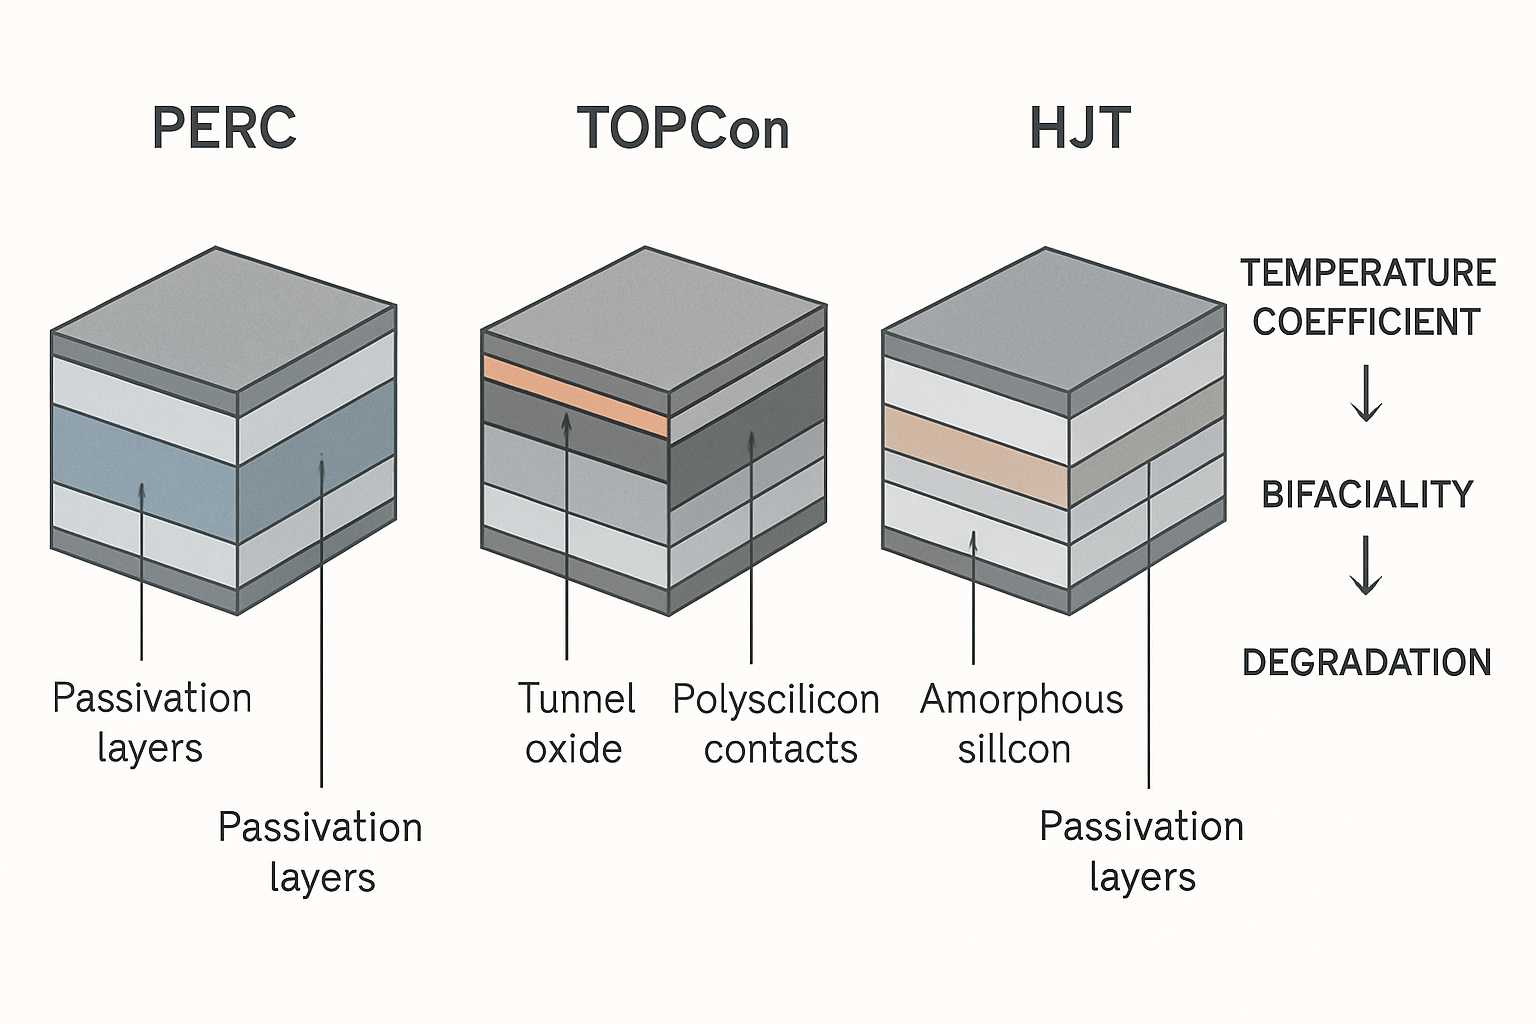
- TOPCon: n‑type passivated contacts cut recombination. Efficiency is high, with a temp coefficient around −0.30%/°C in many datasheets.
- HJT: amorphous silicon passivation lifts Voc and tends to show the best temp behavior, near −0.25%/°C.
- Back Contact (n‑IBC): no front grid shading boosts current; temp coefficient often near −0.29%/°C.
Market data backs the shift to these architectures. According to Solar PV Global Supply Chains, advanced cells such as HJT, TOPCon, and back contact gained share as modules in real operation reached about 22% efficiency. The early roadmap from Technology Roadmap - Solar Photovoltaic Energy 2010 already highlighted strong performance ratios for IBC and HJT. Recent tracking by Renewable Power Generation Costs in 2024 cites 2024 module efficiencies from 21.7% (p‑PERC) to 23.8% (n‑IBC), with back-contact concepts plus passivated contacts projected toward 25.4%–26% in the next decade.
Technology choice is not a lock yet. The U.S. DOE notes that the mainstream successor to PERC remains open, and outlines trade‑offs among TOPCon, IBC, and SHJ on materials, passivation, and manufacturing (Solar Energy).
Heat metrics side‑by‑side
The table shows typical industry ranges. Always verify supplier datasheets and third‑party tests for a given BOM.
| Cell/Module Type | Typical Pmax Temp Coefficient (%/°C) | Typical NOCT (°C) | Notes in Heat |
|---|---|---|---|
| TOPCon (n‑type) | −0.30 ± 0.02 | 43–45 | High efficiency; strong value; slightly larger heat loss than HJT |
| HJT (SHJ, n‑type) | −0.25 ± 0.03 | 42–44 | Best temp behavior; very low LID; often glass‑glass |
| Back Contact (n‑IBC) | −0.29 ± 0.02 | 43–46 | No front grid; high efficiency; temp coefficient near TOPCon |
These ranges reflect typical commercial datasheets as of 2024–2025 and lab‑to‑fab trends summarized by IEA and IRENA. As noted in Renewable Power Generation Costs in 2024, n‑type back contact leads module efficiency in the market today, with TOPCon and SHJ closing the gap. That aligns with small but real heat‑loss differences.

A quick formula
At a cell temperature T, power scales as P(T) ≈ P(25°C) × , where γ is the Pmax temp coefficient expressed per °C.
Worked heat case: 60°C cell temperature
Midday on a dark roof can push cell temperature near 60°C. Using the formula:
- TOPCon, γ = −0.30%/°C: loss = 0.30% × 35 = 10.5%; output ≈ 89.5% of STC
- HJT, γ = −0.26%/°C: loss = 9.1%; output ≈ 90.9% of STC
- Back Contact, γ = −0.29%/°C: loss = 10.2%; output ≈ 89.8% of STC
On a 10 kW DC array, that is about 9.09 kW (HJT) vs 8.95 kW (TOPCon) vs 8.98 kW (Back Contact) at the same cell temperature. The HJT edge is 1.1–1.6 percentage points in this condition. Over a year in hot regions, that often translates to a 0.5–2.0% yield lift, assuming similar albedo and BOS.
Ambient matters. With NOCT near 43–45°C, a 35°C air temperature can raise cells to ~60–65°C under full sun and low wind. Rooftop gaps, color, and airflow shift that by several degrees.
Evidence that these technologies maintain high output at high temps aligns with broader efficiency trends reported by Solar PV Global Supply Chains and ranges compiled in Renewable Power Generation Costs in 2024.
Design moves that cut heat penalties
Mounting and airflow
- Raise modules 100–150 mm off the roof to promote convection. Expect 2–5°C lower cell temperature vs flush.
- Use light‑colored or cool roofs where feasible. A brighter surface can trim several °C under peak sun.
- Prefer open‑rack layouts on ground mounts in hot, calm sites to keep NOCT closer to the low end.
String design and inverter pairing
- Check Voc margins at the coldest site days, as HJT often has higher Voc. Use conservative design limits with temperature‑adjusted Voc.
- Use DC:AC ratios that avoid extended clipping at hot hours. Heat reduces DC power; clipping masks differences among cell types.
- Confirm inverter thermal derating specs. Some units derate above 45–50°C ambient, which can dominate module differences.
Module BOM choices for hot sites
- Glass‑glass laminates resist moisture ingress and PID. They add thermal mass, smoothing peaks.
- n‑type cells reduce LID and LeTID risk. HJT is near‑zero LID. TOPCon and n‑IBC also show low degradation vs legacy p‑PERC, consistent with improvements summarized by IEA.
- High‑reflectance backsheets or bifacial glass can change backside heat balance. Validate with site‑specific modeling.
Which module wins in heat?
Ranking on pure temperature coefficient:
- HJT usually leads with −0.25%/°C class behavior.
- Back Contact and TOPCon follow closely, near −0.29% to −0.30%/°C.
That gap is small yet bankable on hot rooftops and arid ground mounts. HJT converts more midday heat into kWh, while TOPCon often wins on availability and cost. Back Contact competes on peak efficiency and low shade loss. According to IRENA’s 2024 cost review, back contact efficiency leads today and is projected to climb further, with SHJ‑based back‑contact concepts aiming at about 26% in the next decade. Pair that with careful thermal design, and heat losses shrink.
Actionable path: shortlist two SKUs per site, normalize for rated efficiency and area, apply the temperature curve across your TMY file, then re‑rank on net MWh and LCOE. The data approach fits the market picture shared by DOE and aligns with efficiency progress tracked by IEA.
Disclaimer: Technical and procurement content is for information only and not legal, financial, or investment advice.
Practical example: hot urban rooftop
10 kW DC, 18% AC losses, annual plane‑of‑array 2,000 kWh/kW in a hot city:
- TOPCon baseline: assume −0.30%/°C; modeled heat loss 6.8% of annual plane‑of‑array energy; net ≈ 1,865 kWh/kW
- HJT upgrade: −0.26%/°C; heat loss ≈ 6.0%; net ≈ 1,881 kWh/kW (+0.9%)
- Back Contact: −0.29%/°C; heat loss ≈ 6.6%; net ≈ 1,868 kWh/kW (+0.2%)
These deltas match the short‑term 60°C math and reflect realistic gains after clipping and BOS losses.
FAQs
Does bifacial change heat behavior for these cells?
Bifacial frames can alter airflow and thermal mass slightly, but the dominant factor stays the cell’s temp coefficient. Gains from rear‑side irradiance add kWh yet do not fix heat losses. Validate with the same γ applied to both faces.
Is HJT always the best pick in hot climates?
Often on pure heat metrics, yes. Yet total value also depends on price, availability, VOC limits, local O&M, and BOS fit. A TOPCon bill of materials can outperform if it allows tighter DC:AC sizing or better layout.
How do I estimate cell temperature from ambient?
Use NOCT or NMOT from the datasheet. A quick estimate is Tcell ≈ Tamb + (NOCT − 20) × G/800 × (1 − wind factor), with G near 800–1000 W/m². Site wind and mounting drive the biggest spread.
Do these differences matter for storage‑coupled systems?
Yes. Midday heat losses change charging windows and inverter clipping. A cooler‑running module or lower γ can push more energy into the battery during peak sun on hot days, improving self‑consumption.


Leave a comment
All comments are moderated before being published.
This site is protected by hCaptcha and the hCaptcha Privacy Policy and Terms of Service apply.