


Solar power attracts strong opinions. Some claims help buyers plan smarter. Others block good projects. This reference brings solar myths and facts together in one place. It uses data from IEA, IRENA, EIA, and the U.S. Department of Energy. You will see how performance, costs, storage, and safety actually play out on real grids and in real homes. Practical design tips and links to deeper reads are included.

What the data actually shows about performance
Efficiency, output, and the role of temperature
Modern crystalline silicon panels convert about 20%–23% of sunlight into electricity at standard test conditions. That number is module efficiency, not the same as energy yield. Energy yield depends on sun hours, temperature, tilt, shading, and system losses.
- Capacity factor: utility‑scale PV averages roughly 15%–30% depending on latitude, tracking, and clouds. EIA reports higher figures in high‑insolation regions with tracking.
- Temperature coefficient: most modules lose about 0.30%–0.45% of power per °C above 25°C. Good airflow and mounting reduce heat buildup.
- System losses: wiring, inverter, and mismatch losses often total 10%–15% without careful design.
See related myth checks in Solar Performance Myths: Do Clouds, Snow, and Heat Kill Output?.
Clouds, snow, and shade
Clouds cut irradiance, but output rarely drops to zero. Diffuse light still drives production. Expect roughly 10%–60% of clear‑sky output on overcast days, with wide local variation. Snow can block light while it covers modules. After clearing, high albedo can boost yield temporarily. Partial shade can trigger string losses; module‑level power electronics limit the hit.
Lifetime and degradation
Panels last decades with modest power decline. Field studies show median degradation rates near 0.5% per year, with many modern modules below that. Inverters often need replacement once in 10–15 years for string units, longer for some models. The U.S. Department of Energy highlights steady gains in reliability and cost in its Solar Futures work (Energy.gov).
| Claim | Fact | Typical numbers |
|---|---|---|
| Clouds make solar useless | Diffuse light still produces energy | 10%–60% of clear‑sky output on overcast days |
| Heat destroys output | Heat reduces power in a predictable way | −0.30% to −0.45% per °C above 25°C |
| Panels fail after 10 years | Power declines slowly over decades | ~0.2%–0.5% annual degradation (site and product dependent) |
Sources: IEA and DOE summaries on PV performance and reliability. See Energy.gov Solar Energy and IEA.
Grid integration myths vs reality
“Storage is mandatory for solar”
IEA calls this a myth for early and mid phases of variable renewable growth. Power systems already use flexible generators, demand response, and interconnection to balance supply and demand. Storage helps, but it is not a prerequisite for adding PV at modest shares. As shares rise, planners add forecasting, grid upgrades, and flexible resources, including storage, to maintain reliability.
Reference: IEA, Getting Wind and Sun onto the Grid (2017), and System Integration of Renewables (2018). See IEA manual for policy makers.
For homeowners, see Solar Inverters vs Batteries: Myths About Backup Power and Solar FAQs: Straight Answers to 12 Persistent Myths.
“PV needs 1:1 backup from conventional plants”
IEA identifies the 1:1 “backup” claim as false. Systems plan for resource adequacy and ramping, not a simple one‑to‑one reserve. As PV grows, capacity credit declines, yet aggregates of PV, wind, flexible thermal, hydro, storage, and demand response cover peaks together. Smart planning and operations matter more than a simplistic backup ratio.
See Solar Facts by the Numbers: IEA, IRENA, EIA Data Explained.
“PV destabilizes the grid”
Fast inverters, grid codes, and forecasting turn PV into a contributor. Modern inverters offer ride‑through, volt‑VAR, frequency‑Watt, and synthetic inertia features. Distribution planning and tariff design evolve to value flexibility. IEA’s 4‑phase framework shows how needs change with higher shares of variable renewables.
- Phase 1: Little system impact.
- Phase 2–3: Flexibility, forecasting, and limited grid upgrades address most issues.
- Phase 4: High shares call for advanced operations and storage.
Reference: IEA (2017, 2018). Summary at IEA: System Integration of Renewables.
Costs, payback, and incentives
Upfront price vs lifetime value
LCOE for utility‑scale PV has fallen sharply. IRENA reports a global weighted average near USD 0.05/kWh for recent utility PV years, with regional variation. Rooftop PV costs more per kWh, yet offsets retail tariffs, not wholesale energy. That is why rooftop payback can be short in high‑tariff regions.
References: IRENA cost reports, EIA, and Energy.gov. See How to Separate Solar Hype from Facts on Costs and Payback and Solar Costs: Myth vs Reality on Payback, Incentives, ROI.
Payback snapshot for a typical home system
| Item | Assumption | Notes |
|---|---|---|
| Installed cost | USD 2.2–3.5 per W | Market dependent |
| Annual production | 7,500–10,500 kWh | Assumes 1,250–1,750 kWh/kW·yr |
| Retail tariff offset | USD 0.12–0.30 per kWh | Local tariff and net billing rules matter |
| Simple payback | 4–10 years | Depends on incentives and self‑consumption |
Tip: Improve self‑consumption with load shifting, smart inverters, or a right‑sized ESS. Always check local policy and taxes.
Maintenance myths
Solar arrays need periodic cleaning in dusty sites, visual checks, and basic electrical inspections. Many homes plan annual or semi‑annual checks. ESS adds firmware updates and periodic battery health checks. Well‑planned systems often run for long stretches with minimal service. See Solar Maintenance Myths: How Often Panels and ESS Need Care.
Storage and battery myths, clarified
Safety: LiFePO4 vs other chemistries
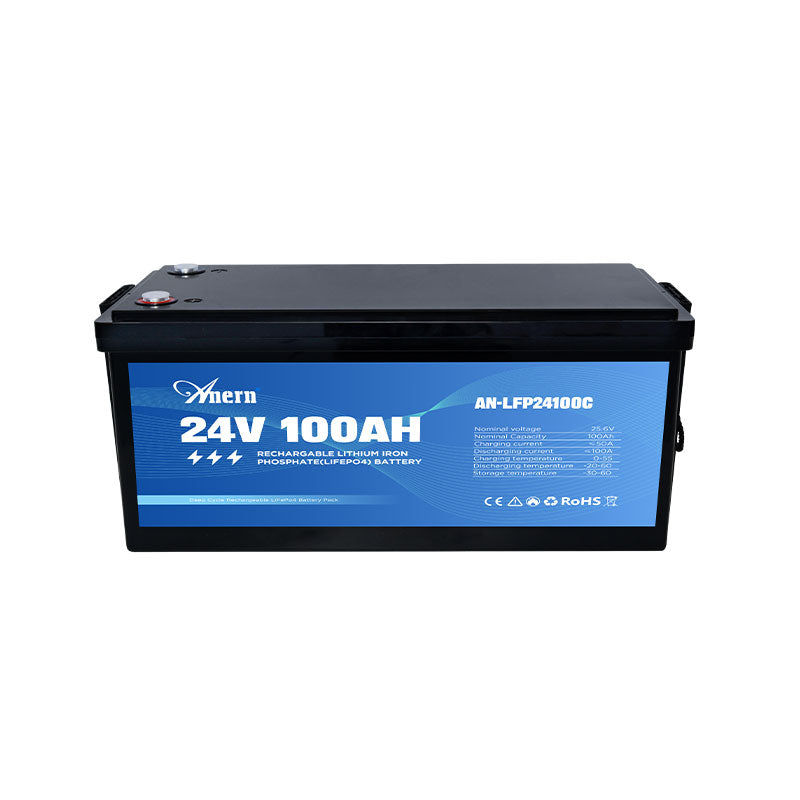
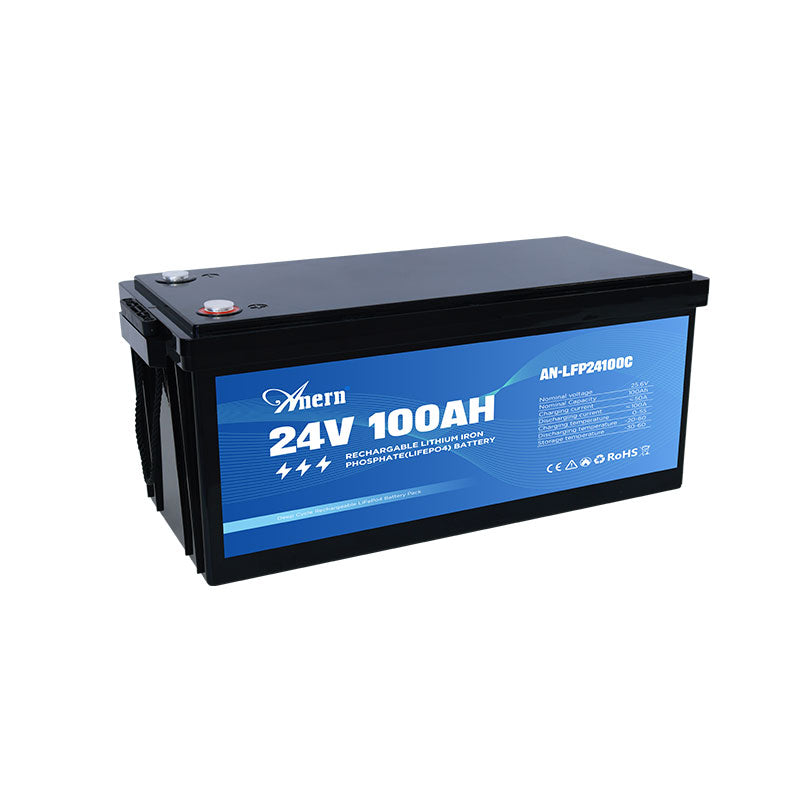
Claim: “All lithium batteries pose the same fire risk.” Fact: Chemistries differ. Lithium iron phosphate (LiFePO4) has a more stable cathode, which can reduce thermal runaway risk relative to some high‑energy chemistries. Safety also depends on cell design, pack engineering, BMS quality, and certification testing. Look for UL 9540/9540A, UN 38.3, and local codes.
See Battery Safety Myths: LiFePO4 vs NMC in Home Solar ESS and Stop Believing These Solar Myths About LiFePO4 Storage.
Cycle life and usable capacity
LiFePO4 cells often deliver thousands of cycles at daily use. A typical range is 3,000–6,000 cycles at 80% depth of discharge within rated temperature. Actual life depends on C‑rate, temperature, and management. Sizing for peak power and daily energy limits stress and can extend service life.
| Chemistry | Usual DoD (warranty) | Cycle life range | Thermal behavior |
|---|---|---|---|
| LiFePO4 | 80%–100% | 3,000–6,000+ | More stable cathode |
| Nickel‑rich Li‑ion | 70%–90% | 2,000–4,000+ | Higher energy density |
Consult product datasheets and certifications for exact ratings. Energy.gov and IEA note continued advances in battery safety and cost.
“An inverter alone gives backup”
Grid‑tied PV without batteries shuts down during outages for line safety. For backup power, you need a hybrid inverter with an energy storage system and a backed‑up loads panel. Some inverters can power small loads from daytime PV during outages if designed for it, yet a battery provides far better coverage. See Solar Inverters vs Batteries: Myths About Backup Power.
System choices: grid‑tied, hybrid, and off‑grid
Grid‑tied without storage
Lowest upfront cost. Best ROI where export credits are fair and outages are rare. Add smart controls to time loads for self‑consumption.
Hybrid (PV + ESS)
Adds backup, peak shaving, and higher self‑consumption. Good where tariffs include time‑of‑use or demand charges, or where outages occur. See Grid-Tied vs Off-Grid: Myths About Outages and Autonomy.
Off‑grid systems
Right fit for remote homes and farms with no grid or costly grid extensions. Needs proper sizing of PV, batteries, and backup generator for winter and long cloudy spells. Real‑life notes here: Off-Grid Solar Case Study: Myths vs Reality on Farms.
- Size PV for worst‑month sun hours.
- Use LiFePO4 with adequate temperature management.
- Include generator auto‑start and fuel planning.
ANERN solutions mapped to facts
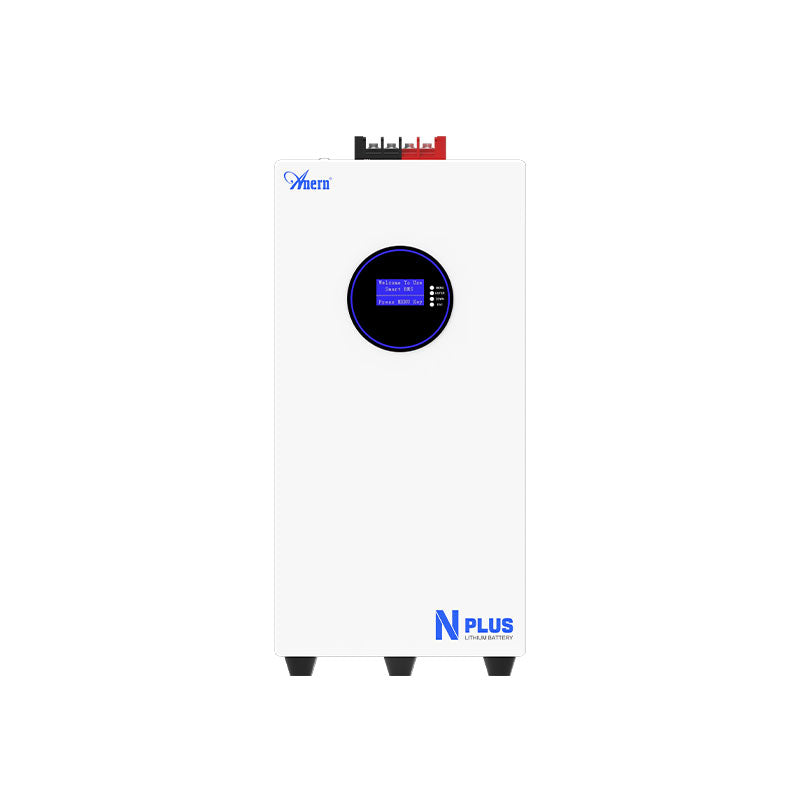
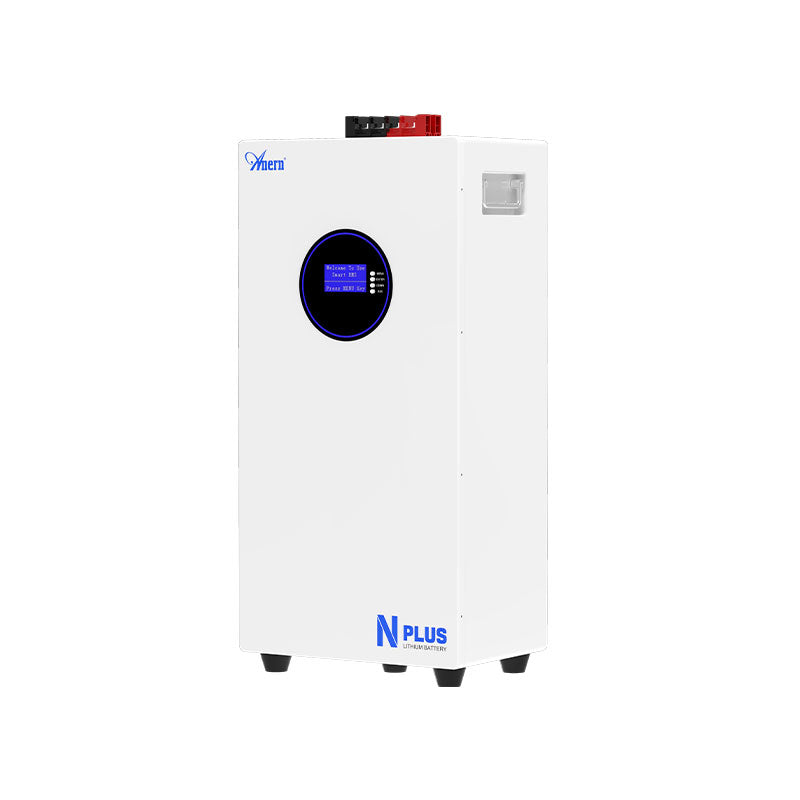
ANERN focuses on lithium battery manufacturing, home energy storage, and integrated ESS. The aim is reliable and scalable energy for households and small businesses seeking more energy independence.
- LiFePO4 lithium battery: High safety margin and stable performance with a robust BMS. Suits daily cycling in homes and small commercial sites.
- Home ESS: Integrated battery, hybrid inverter, and PV. Supports backup, peak shaving, and time‑of‑use optimization.
- Off‑grid solar packages: Panels, charge controllers, batteries, and inverters sized for cabins, farms, and remote sites.
- Solar inverter lineup: DC to AC conversion with MPPT tracking, grid support features, and options for AC‑coupling or DC‑coupling with storage.
| Myth | Reality | Relevant ANERN design focus |
|---|---|---|
| PV must have storage | Storage is optional and value‑driven | Modular ESS that can be added later |
| Batteries are unsafe at home | Safety depends on chemistry and engineering | LiFePO4 packs with BMS and safety testing |
| Solar cannot handle outages | Hybrid PV+ESS supports backed‑up loads | Hybrid inverters with transfer and backup modes |
For quick starts, see Beginners Blueprint: Solar Facts That Outlive Myths and Solar Myths vs Facts: What Every New Homeowner Should Know.
Myths debunked with numbers
“Solar is still too expensive”
IRENA shows global utility‑scale PV costs near USD 0.05/kWh in recent years, down sharply from a decade ago. EIA and Energy.gov confirm rapid cost declines and strong deployment. Rooftop economics depend on local tariffs and policy. Many regions achieve positive cash flow in year one with financing. See Solar Power Myths: 9 Claims Debunked with Real Data.
“Incentives are the only reason PV pays back”
Incentives shorten payback. They are not the whole story. High retail tariffs, time‑of‑use spreads, and smart load shifting can deliver strong returns even as incentives phase down. Solar Costs: Myth vs Reality on Payback, Incentives, ROI details case comparisons.
“PV cannot scale to decarbonize grids”
DOE’s Solar Futures work models deep decarbonization paths with PV as a major contributor by 2035–2050. IEA scenarios show large PV shares with upgrades in flexibility, transmission, and storage. The message is clear: planning and market design unlock scale. References: Energy.gov: Solar Futures Study, IEA.
Design tips that turn facts into better systems
Site and array
- Measure shading across seasons. A small tree can cost hundreds of kWh per year.
- Match tilt and azimuth to load profile. East‑west arrays boost morning and late‑day output.
- Vent panels for better cooling. Lower temperatures raise power.
Inverter and wiring
- Size inverter DC/AC ratio thoughtfully. A mild DC oversize smooths morning and evening output.
- Keep voltage drop under 2% on long runs. Oversize conductors where needed.
- Use arc‑fault and rapid shutdown equipment per code.
Storage sizing and control
- Size kWh for your evening and overnight use, not just nameplate power.
- Check peak power rating (kW) against motor starts and backup loads.
- Use time‑of‑use charge/discharge windows to earn value daily.
New to this topic? Start with Beginners Blueprint: Solar Facts That Outlive Myths and Solar FAQs: Straight Answers to 12 Persistent Myths.
Quick myth vs fact table
| Myth | Fact | Source |
|---|---|---|
| Storage is a must for PV | PV integrates without storage at modest shares; storage adds value as shares grow | IEA (2017) |
| PV needs 1:1 backup | Systems plan for flexibility and adequacy, not one‑to‑one backup | IEA (2018) |
| Solar is too costly | Global utility PV near ~USD 0.05/kWh in recent years | IRENA |
| PV kills grid stability | Modern inverters support grid with advanced functions | Energy.gov |
Wrap‑up and next steps
Facts beat myths. Data from IEA, IRENA, EIA, and DOE shows that solar works with today’s grids, costs have fallen, and storage adds targeted value. Good design and right‑sizing matter. LiFePO4 storage improves safety margins and daily cycling in home ESS. Plan for your site, your tariffs, and your backup needs.
Suggested reads for your next step:
- Solar Myths vs Facts: What Every New Homeowner Should Know
- Solar Facts by the Numbers: IEA, IRENA, EIA Data Explained
- Solar Costs: Myth vs Reality on Payback, Incentives, ROI
- Grid-Tied vs Off-Grid: Myths About Outages and Autonomy
Citations and authority sources:
- IEA: Getting Wind and Sun onto the Grid (2017); System Integration of Renewables (2018) — iea.org
- IRENA: Renewable Power Generation Costs — irena.org
- EIA: Solar statistics and trends — eia.gov
- U.S. Department of Energy: Solar Futures and technology resources — energy.gov
