The structural integrity of a rooftop solar installation is fundamental to its safety, longevity, and performance. Two of the most significant environmental forces acting on these systems are wind uplift and snow drift. Without accurate modeling, these forces can lead to component failure, roof damage, or even complete system dislodgement. Understanding the engineering principles behind uplift and drift analysis allows for the design of robust and reliable solar panel mounting systems that withstand the elements.
Understanding Aerodynamic Forces: Wind Uplift
When wind moves over a building, it creates complex pressure differentials across the roof surface. For a solar array, these forces are amplified, making wind load engineering a critical part of the design process. Proper uplift modeling ensures the mounting system can resist these forces securely.
The Physics of Wind Uplift on Solar Arrays
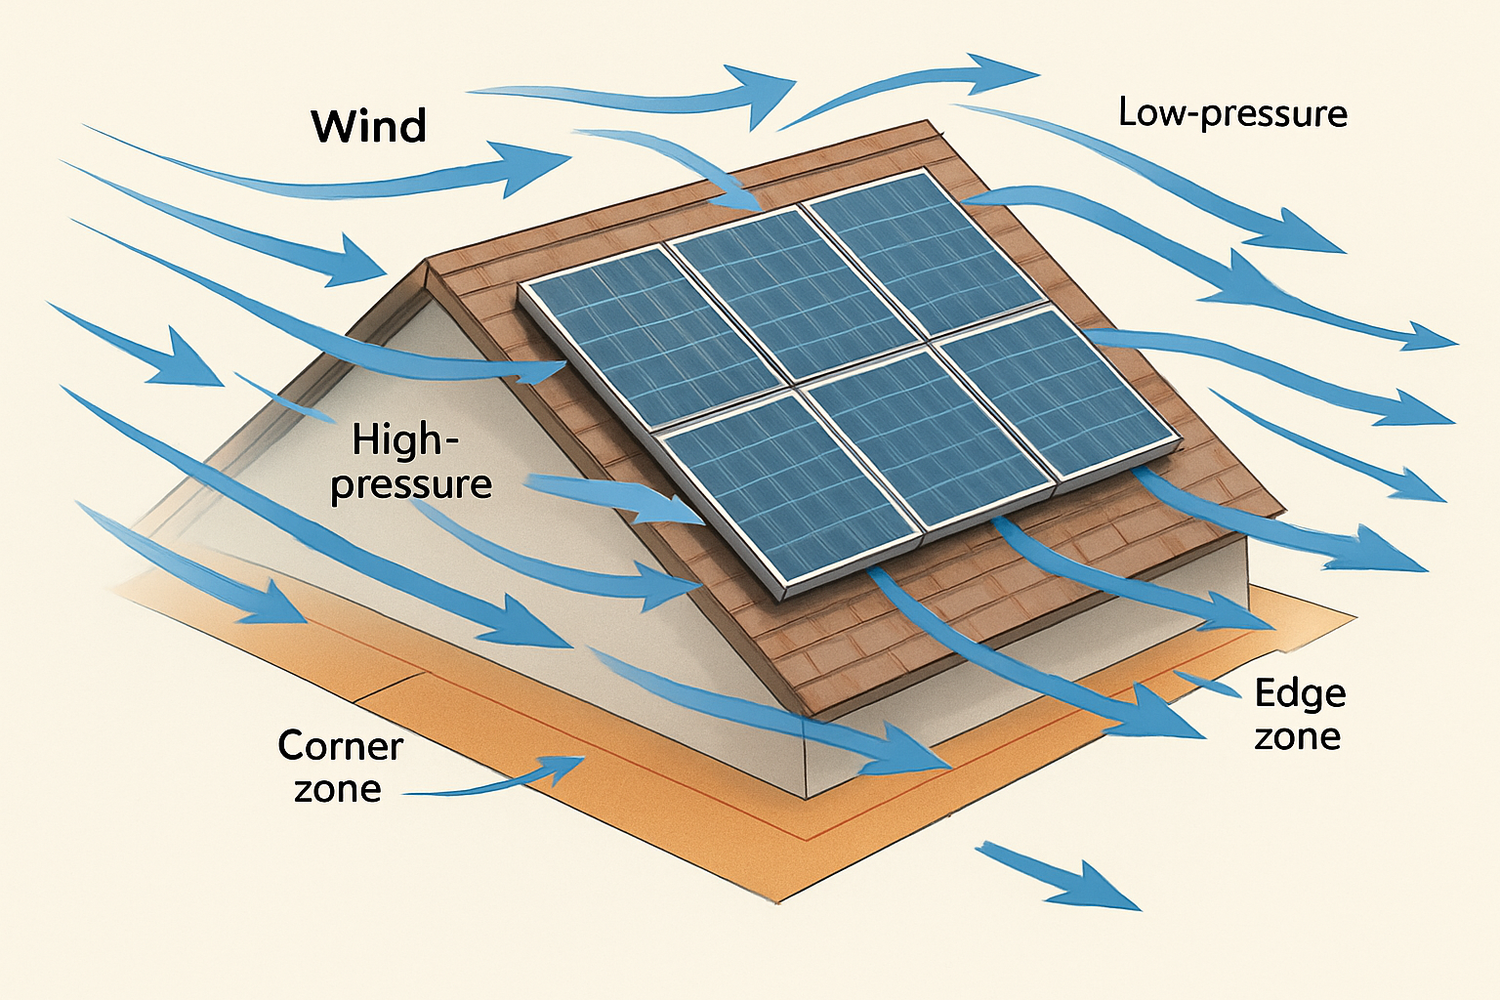
As wind flows over a tilted solar panel, it must travel a longer distance over the top surface compared to the bottom. This creates a pressure difference, resulting in a net upward force, or uplift. The most intense uplift forces occur not in the center of the roof, but at its edges and corners. These zones experience significantly higher negative pressures, which can be two to three times greater than the pressure in the main field of the roof. A failure often begins at a corner and propagates, leading to a cascading effect across the array.
Key Parameters for Uplift Modeling
Uplift modeling relies on a set of standardized inputs, primarily derived from the ASCE 7 (Minimum Design Loads for Buildings and Other Structures) standard. Accurately determining these parameters is the first step toward a safe design. According to a report by the IEA, the increasing scale of distributed energy resources like rooftop solar makes standardized safety and reliability more important than ever. As detailed in the Integrating Solar and Wind report, the stability of individual systems contributes to the resilience of the entire grid.
| Parameter | Description | Source / Example |
|---|---|---|
| Basic Wind Speed | The 3-second gust speed for a specific geographic location. | ASCE 7 wind maps or local building codes. |
| Risk Category | Classifies buildings by their use and occupancy, determining the level of safety required. | Category II for most homes; Category IV for hospitals. |
| Exposure Category | Describes the roughness of the surrounding terrain (e.g., urban, suburban, open). | Category B (urban/suburban) or C (open terrain). |
| Building Height & Roof Slope | The physical dimensions of the structure that influence wind pressure. | Measured directly from architectural plans or on-site. |
| Panel Location | Identifies if panels are in an interior, edge, or corner zone of the roof. | Defined by ASCE 7 based on roof geometry. |
The Modeling Process: From Data to Design Pressure
The modeling workflow translates raw data into actionable design pressures. The process begins by selecting the basic wind speed from a map and adjusting it for factors like building height, exposure, and topography. This yields the velocity pressure (qz). Next, pressure coefficients (Cp) are applied. These coefficients, found in ASCE 7, account for the building's shape and the specific location on the roof. The final design wind pressure (p) is calculated by multiplying the velocity pressure by the appropriate pressure coefficients. For highly irregular roof shapes or critical facilities, engineers may use Computational Fluid Dynamics (CFD) to create a more detailed and precise model of airflow and pressure.
Analyzing Environmental Loads: Snow Drift and Accumulation
In colder climates, snow load engineering is just as critical as wind analysis. Snow rarely accumulates in a uniform blanket. Instead, wind causes it to drift and pile up against obstructions, including solar arrays. This creates concentrated loads that can far exceed the balanced snow load a roof is designed to handle.
How Snow Drifts Form on Rooftops
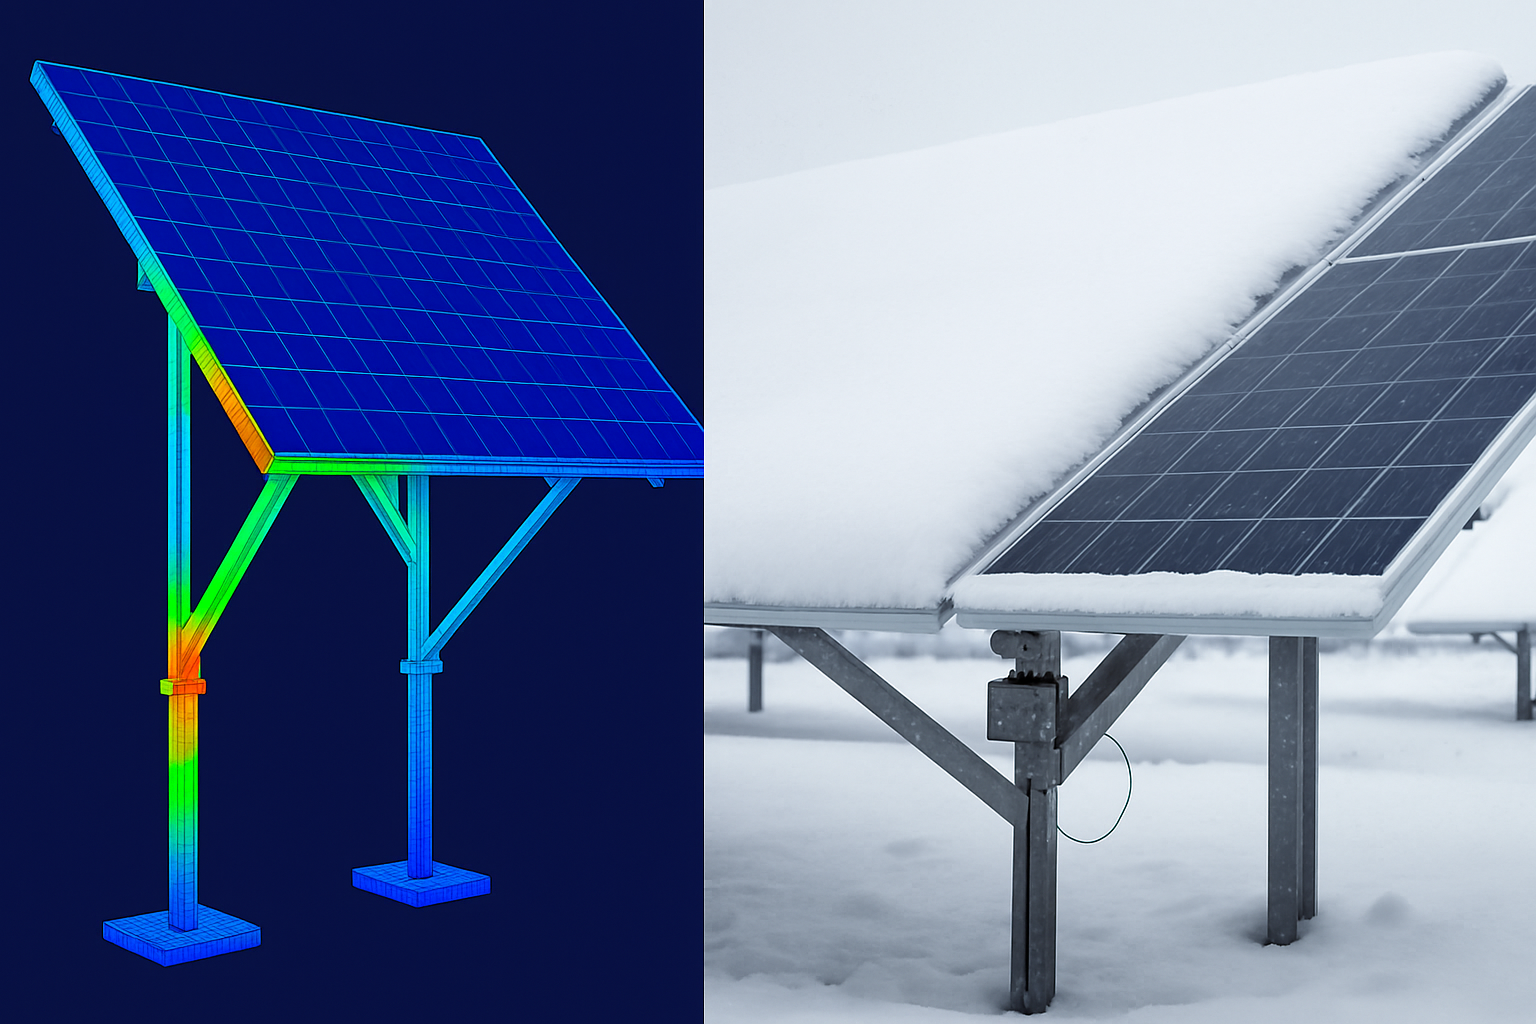
Solar panels act as an obstruction to wind, similar to a snow fence. Wind blowing across the roof will scour snow from the upwind side and deposit it in a wedge-shaped drift on the downwind (leeward) side of the array. The size and weight of this drift depend on the height of the obstruction, the amount of available snow, and the wind's intensity. This creates an unbalanced load, placing significant stress on the mounting hardware and the roof structure directly beneath it.
Essential Inputs for Snow Load Calculation
The basis for any snow load calculation is the ground snow load (pg), which is determined from regional climate data. This base value is then adjusted by several factors to find the design snow load for a specific roof. These include the thermal factor (Ct), which accounts for heat loss from the building melting some snow; the exposure factor (Ce), which considers how exposed the roof is to wind; and the importance factor (Is), which is based on the building's risk category. The combination of these inputs provides a more accurate picture of the potential snow load.
Modeling Snow Drifts Around Solar Arrays
Modeling snow drifts created by solar panels involves calculating the additional surcharge load. ASCE 7 provides formulas to determine the geometry and density of these drifts. The calculation considers the height of the panel array off the roof surface and the length of the roof available for snow to accumulate. The result is an additional pressure (in pounds per square foot) that must be added to the balanced snow load in the specific area where the drift forms. This ensures that the mounting system and the underlying roof structure can support the concentrated weight.
Integrating Uplift and Drift into Mounting System Design
The calculated uplift and drift loads directly inform the selection of mounting hardware and the overall system layout. This is where theoretical models are translated into a safe, physical installation.
Selecting the Right Mounting Components
Design pressures from uplift modeling dictate the required strength and spacing of mounting components. For example, higher uplift forces may require stronger rails, a reduced span between roof attachments, or clamps with greater holding capacity. Similarly, high snow drift loads demand robust components that will not bend or fail under the concentrated weight. Every part of the system, from the smallest clamp to the largest rail, must be rated to handle the calculated maximum loads.
The Role of Ballasted vs. Attached Systems
The modeling approach influences the choice between ballasted and attached systems. For mechanically attached systems, the primary concern is the pull-out strength of the fasteners connecting the mounts to the roof structure. The uplift model determines the force each attachment point must resist. For ballasted systems, which are held in place by weight, the model ensures that the total weight of the ballast blocks is sufficient to counteract the calculated uplift and sliding forces, providing a safety factor against movement.
Verifying Performance with Testing
Modeling provides the theoretical basis for design, but physical testing validates it. Manufacturers use wind tunnel testing to refine the aerodynamic properties of their mounting systems and mechanical load testing to confirm the ultimate strength of their components. Proper modeling is the first step, but verifying the real-world performance of your entire system, including solar storage, is equally important. As outlined in the Ultimate Reference for Solar & Storage Performance, factors like battery cycle life and inverter efficiency under varying loads contribute to the long-term viability of the project.
A Practical Summary of the Modeling Workflow
A successful and safe rooftop solar installation depends on a methodical engineering workflow. The process starts with a thorough site assessment to gather all necessary data, from building dimensions to local wind and snow conditions. This is followed by a detailed analysis, applying established standards like ASCE 7 to calculate the precise uplift and drift loads. Finally, these calculated loads are used to specify a complete mounting system, including the correct components, spacing, and attachment methods. This structured approach is essential for ensuring the safety, durability, and long-term performance of any rooftop solar investment.
Disclaimer: This content is for informational purposes only. Always consult a qualified structural engineer for the design and verification of solar mounting systems. All designs must comply with local building codes and regulations.
Frequently Asked Questions
What is the most critical factor in wind uplift modeling?
Corner and edge zones of the roof experience the highest uplift pressures. Accurately identifying these zones and applying the correct pressure coefficients is critical. Neglecting this can lead to localized failures that cascade across the array.
How do solar panels change the snow load on a roof?
Solar panels can act like a snow fence, causing wind to deposit more snow in drifts on their leeward side. This creates an unbalanced load that is often much higher than the uniform snow load the roof was originally designed for. This additional drift load must be calculated and accounted for in the mounting system design.
Can I use online calculators for uplift and drift analysis?
Online calculators can be a useful preliminary tool for estimation. However, for a final design used for permitting and installation, a detailed analysis following ASCE 7 standards and performed by a qualified engineer is necessary. These calculators may not account for all site-specific variables.
Does the tilt angle of the panels affect uplift and drift?
Yes, significantly. A higher tilt angle can increase the wind uplift force on the panels. For snow, a steeper tilt can promote shedding but may also create a larger obstruction, leading to a taller, heavier drift behind the array. The optimal angle involves balancing energy production with structural load management.


Leave a comment
All comments are moderated before being published.
This site is protected by hCaptcha and the hCaptcha Privacy Policy and Terms of Service apply.