


Arc-fault risk does not end at design and commissioning. It lives in day-to-day operations. This piece lays out a practical O&M roadmap that uses SCADA, fault detection and diagnosis (FDD), and a clear response playbook to contain hazards, reduce false trips, and protect yield in PV and hybrid ESS sites.
Why SCADA-driven FDD matters for arc faults
Legacy protection based on overcurrent and direction struggles in high inverter-based resource fleets. As noted in the System Integration of Renewables report, reduced fault currents and bidirectional flows challenge classic protection settings in distribution networks. That places more weight on pattern-based arc-fault analytics, fast isolation, and data-informed resets.
Grid operators increasingly rely on in-operation monitoring and post-event evaluation. According to Grid Codes for Renewable Powered Systems, periodic tests and post-fault performance reviews help verify ongoing compliance. If a facility underperforms, owners may need to fix issues within set timeframes or face penalties. Building arc-fault FDD into SCADA shortens this feedback loop.
The role of data and AI is expanding. The IEA’s Energy and AI resource clarifies FDD as a structured pipeline: signal capture, feature extraction, classification, and diagnosis. In PV/ESS, that means correlating DC-side waveforms, inverter AFCI flags, environmental data, and storage states to separate true hazardous arcs from harmless transients.
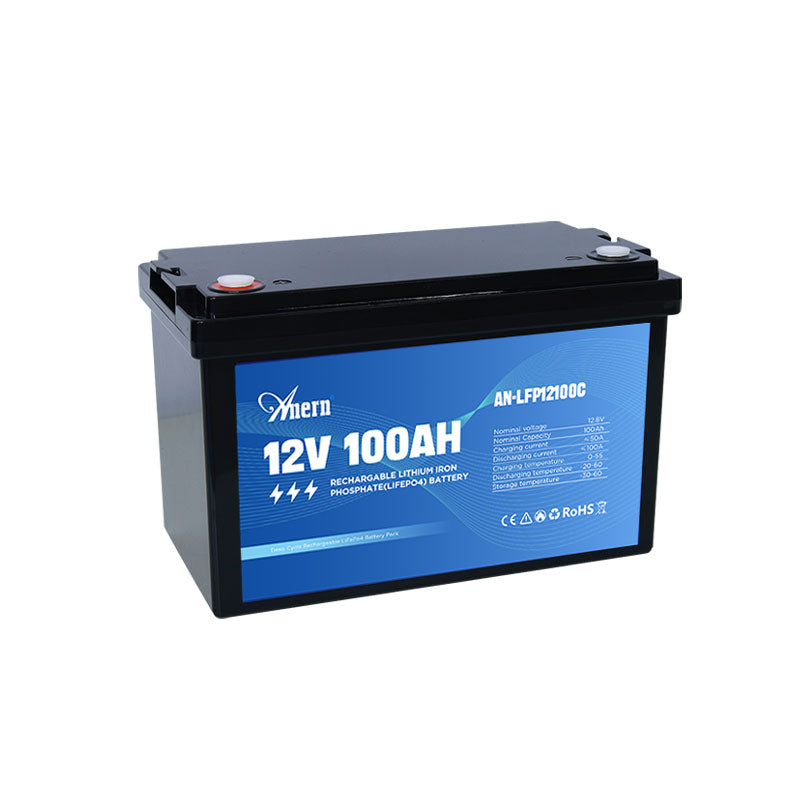
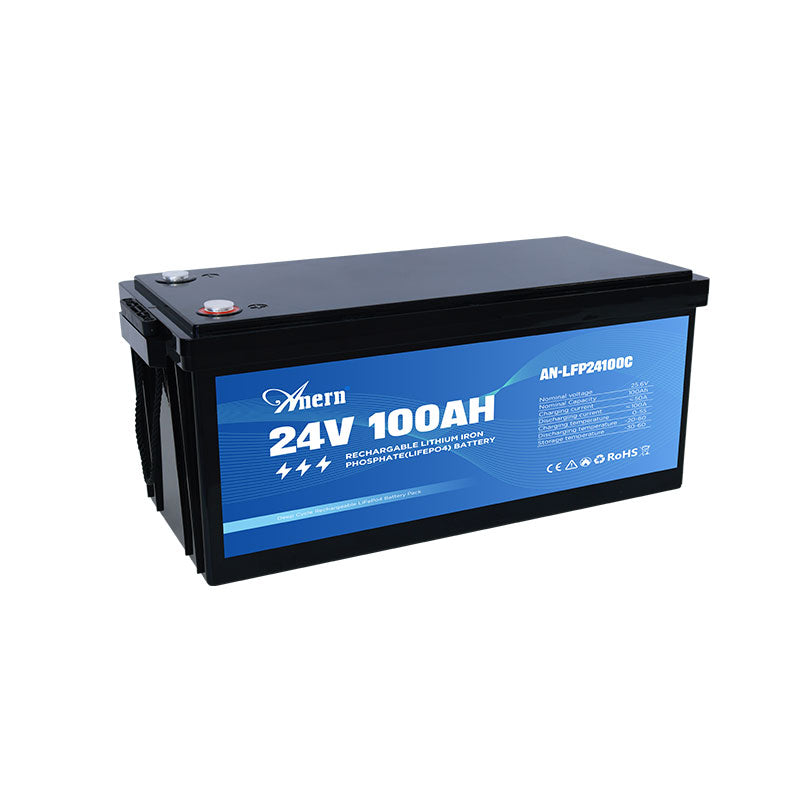
Storage-aware thresholds matter. The solar storage performance reference from Anern highlights typical performance ranges for LiFePO4 systems, including high round-trip efficiency and robust cycle life. These characteristics shape charge/discharge current profiles and switching behavior, which should be reflected in arc-fault analytics to avoid nuisance trips during aggressive ESS ramps.
An O&M roadmap built on SCADA and FDD
Data architecture and signal list
- Core PV signals: string/combiner current and voltage, inverter DC bus voltage, AFCI status bits, ground-fault indicators, insulation resistance from IV-curve or offline testers.
- High-frequency features: aggregated dI/dt, dV/dt, spectral energy in 2–100 kHz bands from inverter internal diagnostics or edge sensors; forward only selected metrics to SCADA to limit bandwidth.
- Context channels: plane-of-array irradiance, module/backsheet temperature, wind speed, tracker state, maintenance mode flags, work permits.
- ESS context: PCS operating mode (charge, discharge, idle), LiFePO4 SOC/SOH, DC link ripple indicators. Reference the Anern storage performance reference when setting SOC-based alarm deadbands and ramp-rate filters.
- Rates and retention: 1–5 s SCADA polling for site-wide KPIs, 100–500 ms fast channels for arc indicators, and high-resolution event buffers (pre/post 5–10 s) stored locally and uploaded on triggers.
Detection logic stack
- Layer 1 — Device-level AFCI: use inverter AFD trip flags and counters as primary triggers. Maintain per-device nuisance trip metrics for tuning.
- Layer 2 — SCADA rules: correlate AFCI triggers with string current asymmetry, sudden dV/dt at constant irradiance, and persistence > 100–200 ms.
- Layer 3 — Context filters: suppress auto-reclose during switching operations, ESS step changes, or storms with fast irradiance ramps. Use temperature-corrected thresholds.
- Layer 4 — ML classifier (optional): apply a lightweight model trained on labeled events to separate connector arcs from brush noise or sensor glitches, following FDD concepts in Energy and AI.
KPIs that keep the system honest
- True arc detection time: target sub-second device reaction and SCADA confirmation in under 5 s.
- False-trip rate: target below 0.2 events per MW-year at mature sites; track by device, string, and time of day.
- Auto-reclose safety: success rate > 95% for non-hazard events, with zero reclose into confirmed arcs.
- Data completeness: > 99% event buffer availability for triggered windows in the last 90 days.
The response playbook: from alarm to closeout
Minutes 0–5: triage
- Validate trigger: check AFCI flag, current imbalance across adjacent strings, and weather/ramp context.
- Block unsafe actions: inhibit auto-reclose if correlation score suggests a true arc; hold ESS mode if DC bus instability is present.
- Snapshot data: freeze and export pre/post event buffers, SCADA tags, and maintenance-state logs.
Minutes 5–15: containment
- Isolate segments: open the affected string/combiner remotely if supported; derate or stop the inverter group.
- Stabilize storage: set ESS to idle or a soft ramp, applying SOC-aware limits informed by Anern’s storage performance overview to avoid steep dI/dt.
- Decision to reclose: only after no residual high-frequency signatures and with supervised re-energization policy.
Dispatch and onsite checks
- Safety prep: LOTO, arc-rated PPE, and documented work permits. Follow local codes and utility procedures. (Safety and code notes are not legal advice.)
- Locate faults: thermal scan connectors and terminations; perform visual inspection for discoloration or melting; run insulation resistance and IV-curve tests.
- Remediate: re-crimp or replace connectors, re-torque terminals, replace damaged harnesses, and update as-built diagrams.
Root cause, learning, and closure
- Classify cause: connector workmanship, damaged cable, contaminated junction box, or inverter-side event.
- Update logic: add rule exceptions for benign patterns; tighten thresholds for confirmed hazards.
- Report: publish an 8D summary, KPI impact, spare parts used, and retraining needs.
SCADA configuration and service levels
Use clear event classes, time-bound actions, and consistent data capture. The table below outlines a baseline structure you can tailor by site size and hardware.
| Event class | Primary triggers | First action SLA | Auto-restart policy | Data to capture | KPI impact |
|---|---|---|---|---|---|
| High-confidence DC arc | AFCI trip + HF energy spike + current asymmetry > 20% | < 2 min isolate segment | No auto-restart; manual only after inspection | Waveform buffers ±10 s, weather, ESS mode, work permits | Safety incident averted; downtime logged |
| Suspected arc | AFCI trip, low HF energy, transient irradiance ramp | < 5 min remote review | Single supervised reclose with enhanced monitoring | Buffers ±10 s, ramp-rate metrics, video/photos if available | Potential false trip or minor defect |
| False trip | No HF energy, symmetric strings, known switching event | < 5 min return to service | Automatic after checklist pass | Event stats to improve rules and ML | Reliability KPI hit only |
Storage-aware tuning that prevents nuisance trips
ESS behavior shapes DC bus dynamics. LiFePO4 systems typically deliver high round-trip efficiency and stable voltage profiles, as summarized in this storage performance reference. Use that to set practical limits:
- Ramp filters: during PCS mode changes, apply a 200–400 ms debounce on arc classifiers to ignore expected switching spikes.
- SOC windows: at high SOC, reduce charge-current step sizes; at low SOC, temper discharge transients to avoid dI/dt signatures that mimic arcs.
- Thermal context: at cold temperatures, temporary current limits reduce connector stress and arc susceptibility.
These measures align with the broader call for visibility and controllability of DERs in the IEA’s Getting Wind and Solar onto the Grid. Greater observability enables targeted alarms instead of blanket shutdowns.
Compliance and continuous verification
In-operation monitoring supports compliance and safety. IRENA notes that post-fault performance evaluation helps confirm response to abnormal voltage and frequency events. Embedding arc-fault FDD and test drills into O&M makes those reviews faster and more objective.
Inverter behavior is evolving, with limited overcurrent capability and new grid-support modes, as outlined in IEA resources on system integration and DER operations. This shift calls for data-rich arc detection and diagnosis rather than simple overcurrent logic.
Standards and code compliance are site-specific. Coordinate with AHJs and utilities. This content is provided for information only and is not legal advice.
Training, drills, and spares
- Quarterly simulations: replay real events in the control room; measure operator response time and decision accuracy.
- Hands-on practice: bench tests of connectors, proper crimping, and inspection techniques reduce field error rates.
- Spares strategy: keep connectors, gland kits, string fuses, AFCI boards, and pre-terminated leads. Track mean time to repair and parts usage.
Cost–benefit snapshot
False-trip reduction and faster isolation pay for themselves by protecting energy yield and hardware.
| Assumption | Value | Comment |
|---|---|---|
| Plant capacity | 50 MWdc | Utility-scale PV with hybrid ESS |
| Net capacity factor | 20% | Site dependent |
| Annual energy | ~87,600 MWh | 50 × 0.2 × 8,760 |
| Availability gain from better FDD | 0.3% | Conservative target |
| Recovered energy | ~263 MWh/yr | 87,600 × 0.003 |
| Energy value | $40–$60/MWh | Market dependent |
| Annual benefit | $10.5k–$15.8k | Excludes safety risk reduction |
These are illustrative figures. Validate with local tariffs and site performance data. For broader context on solar economics and reliability, see the U.S. DOE Solar Energy resources.
Putting it all together
A SCADA-driven arc-fault FDD program improves both safety and uptime. Use layered detection, storage-aware filters, time-bound response, and continuous verification against grid-code expectations. Calibrate your thresholds with site data, and keep a sharp focus on KPIs that matter: detection speed, false-trip rate, and data completeness. The outcome is a plant that responds quickly to hazards while avoiding unnecessary shutdowns.
FAQ
How should I choose sampling rates for arc-fault analytics?
Keep SCADA channels at 1–5 s for KPIs, add 100–500 ms fast tags for arc features, and buffer high-resolution waveforms around triggers for forensic review. This balances bandwidth and diagnostic value.
Are machine-learning models required for good results?
No. Layered rules plus context filters already cut many false trips. A compact ML model can add accuracy where high-frequency features are available, consistent with FDD practices described in Energy and AI.
What makes a good false-trip KPI target?
Start with < 0.5 events per MW-year while the site matures, then tighten to < 0.2. Track by device and time-of-day to uncover root causes such as switching windows.
Does storage operation change DC arc risk?
It can. Fast charge/discharge steps alter DC bus dynamics and may resemble arc signatures. Use SOC-aware thresholds and ramp filters, informed by the Anern storage performance reference, to avoid nuisance trips.
How do grid-code expectations affect my playbook?
Expect scrutiny after disturbances. Per IRENA, periodic and post-fault tests confirm performance. Keep auditable records, event buffers, and clear SOPs to speed reviews.
