












Maintaining a remote, off-grid solar array involves more than just regular cleaning. While keeping panels free of dust and debris is a critical first step, it doesn't reveal what's happening inside the panels. Hidden electrical issues can silently reduce your power output, strain your components, and compromise your energy independence. To truly understand your system's health, you need to look deeper. Advanced diagnostic tools like thermal imaging and I-V curve tracing provide the insights necessary to identify and fix problems that the naked eye cannot see, ensuring your array performs at its peak for years to come.
Understanding Thermal Imaging for Solar Panel Audits
Thermal imaging, or thermography, is a non-invasive technology that creates a visual representation of temperature. For solar arrays, it's a powerful tool for quickly spotting anomalies. A healthy solar panel operating under the sun should have a relatively uniform temperature across its surface. When problems arise, they often manifest as heat.
What is Thermal Imaging and How Does It Work for Solar?
A thermal camera detects infrared radiation emitted by an object and translates it into a temperature map called a thermogram. In this map, different colors correspond to different temperatures. Cooler areas might appear as blue or purple, while warmer areas show up as yellow, orange, or red. By scanning your solar panels, you can instantly identify any 'hot spots' that indicate an underlying issue. This method allows for a rapid health check of an entire array without disconnecting a single wire.
Identifying Common Problems with a Thermal Camera
A thermal scan can reveal several types of defects that degrade performance:
- Hot Spots and Cellular Defects: These are one of the most common faults. A small, intensely hot area on a single cell often points to a manufacturing defect, a microcrack, or an internal short circuit. This defect increases electrical resistance, causing the faulty cell to dissipate energy as heat instead of producing power.
- Defective Bypass Diodes: Bypass diodes are safety devices within a panel's junction box. They are designed to activate when a cell or group of cells is shaded or underperforming, creating a path for the current to 'bypass' the weak section. If a diode fails in a shorted state, it can cause an entire string of cells to heat up, creating a distinct rectangular or linear pattern on the thermal image.
- Soiling and Shading Patterns: While you can see heavy soiling, thermal imaging shows its electrical impact. Uneven soiling or partial shading from a nearby object causes some cells to work harder than others, leading to temperature imbalances that are clearly visible on a thermogram.
The Power of I-V Curve Tracing
If thermal imaging is the quick 'X-ray' that finds a problem area, I-V curve tracing is the detailed 'blood test' that provides a definitive diagnosis. It offers precise, quantitative data about a solar panel's electrical performance.
What is an I-V Curve and What Does It Tell You?
An I-V (Current-Voltage) curve is a graph that plots the relationship between the current (I) and voltage (V) produced by a solar panel under specific conditions of sunlight (irradiance) and temperature. This graph reveals the panel's key performance metrics, including its Open-Circuit Voltage (Voc), Short-Circuit Current (Isc), and, most importantly, its Maximum Power Point (Pmax). By comparing a panel's measured I-V curve to the manufacturer's datasheet specifications, you can precisely quantify its performance and health.
Diagnosing Performance Issues with I-V Curve Data
The shape of the I-V curve is a powerful diagnostic indicator:
- Degradation and Mismatch: A measured curve that is 'flatter' or has a lower Pmax than the reference curve indicates performance degradation. This could be due to natural aging (LID, PID) or damage. When panels in a string are mismatched, the overall string curve will show a distorted shape, limiting the output to the level of the weakest panel.
- Shading and Soiling Effects: Partial shading creates distinctive 'steps' or 'knees' in the I-V curve. Each step corresponds to a group of cells affected by shading, showing a clear drop in current production. This is a definitive way to confirm that shading is the root cause of power loss.
- High Series Resistance: A reduced slope on the I-V curve near the Voc point is a classic sign of high series resistance. This problem is often caused by corroded connections, loose wiring, or failing internal components, all of which lead to significant power loss.
Integrating Thermal and I-V Data for a Complete Audit
Using thermal imaging and I-V curve tracing together provides a comprehensive picture of your array's health. This two-pronged approach allows for efficient and accurate troubleshooting, saving time and preventing incorrect diagnoses.
A Two-Pronged Approach for Accurate Diagnosis
The ideal workflow combines the strengths of both tools. Thermal imaging is used for a rapid, qualitative scan of the entire array to flag suspicious panels. I-V curve tracing is then used on those specific panels to gather quantitative data and confirm the exact nature and severity of the fault. This prevents the time-consuming process of performing I-V traces on every single panel in the array.
| Feature | Thermal Imaging | I-V Curve Tracing |
|---|---|---|
| Primary Use | Rapidly identify temperature anomalies (hot spots) | Quantify electrical performance and degradation |
| Type of Data | Qualitative (visual temperature map) | Quantitative (Voltage, Current, Power) |
| Speed | Fast; can scan large arrays quickly | Slower; requires connection to each panel/string |
| Common Issues Found | Hot spots, failed bypass diodes, soiling patterns | Degradation, mismatch, shading effects, high resistance |
| Required Conditions | High solar irradiance for clear temperature contrast | Stable solar irradiance and temperature for accurate data |
The Impact on Your Off-Grid System and Lithium Battery
Underperforming solar panels don't just reduce your daily energy harvest; they have a cascading effect on your entire off-grid system, particularly your energy storage.
How Underperformance Affects Energy Independence
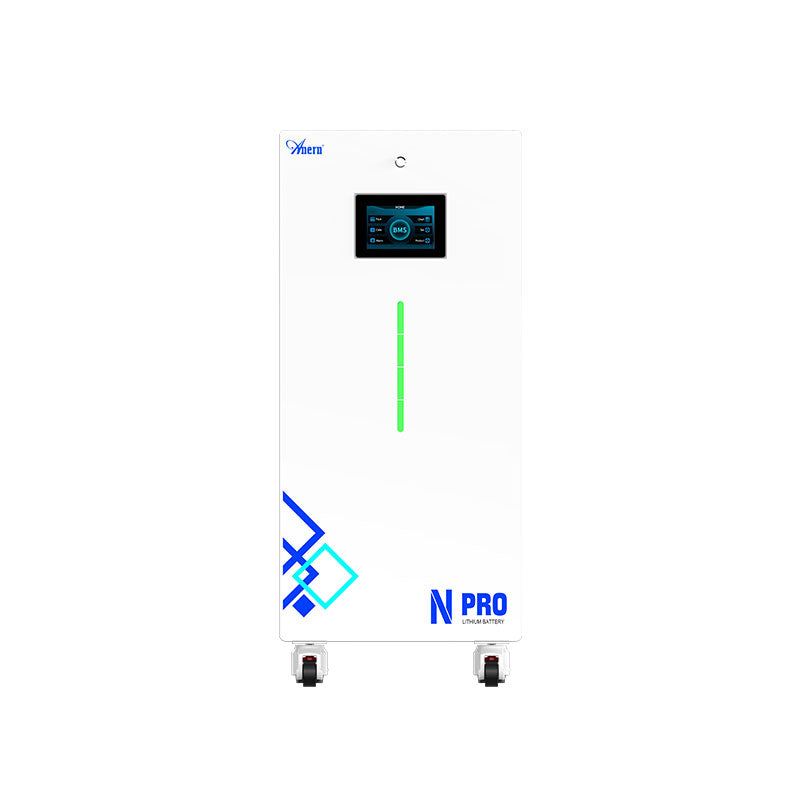
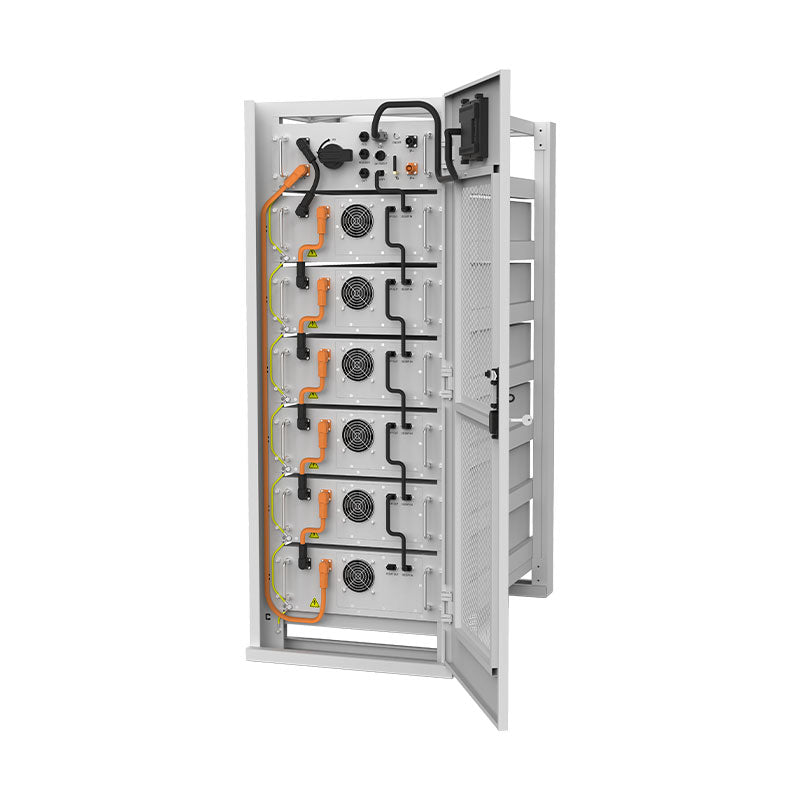
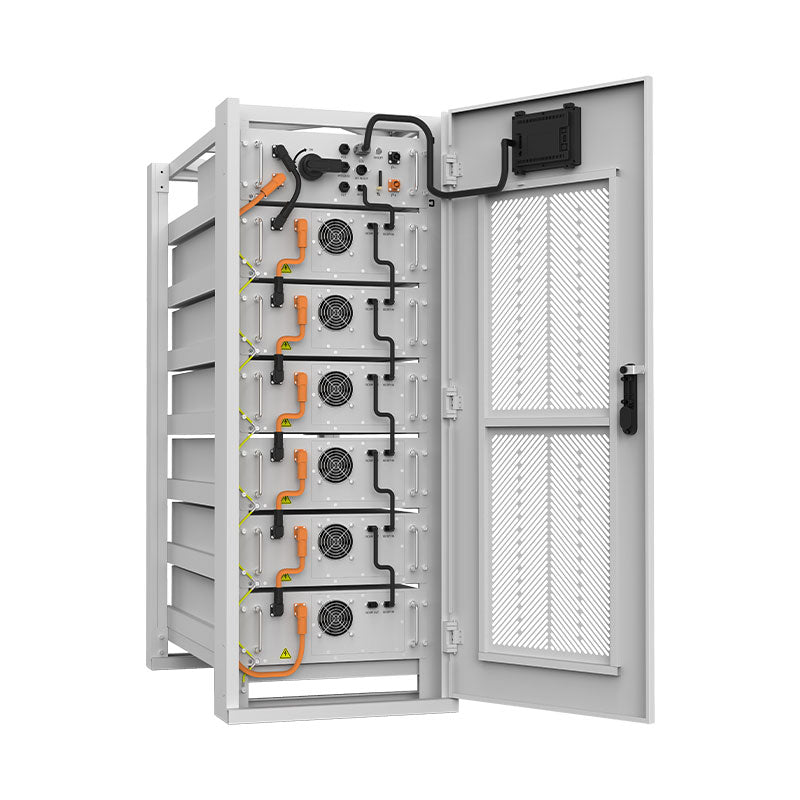
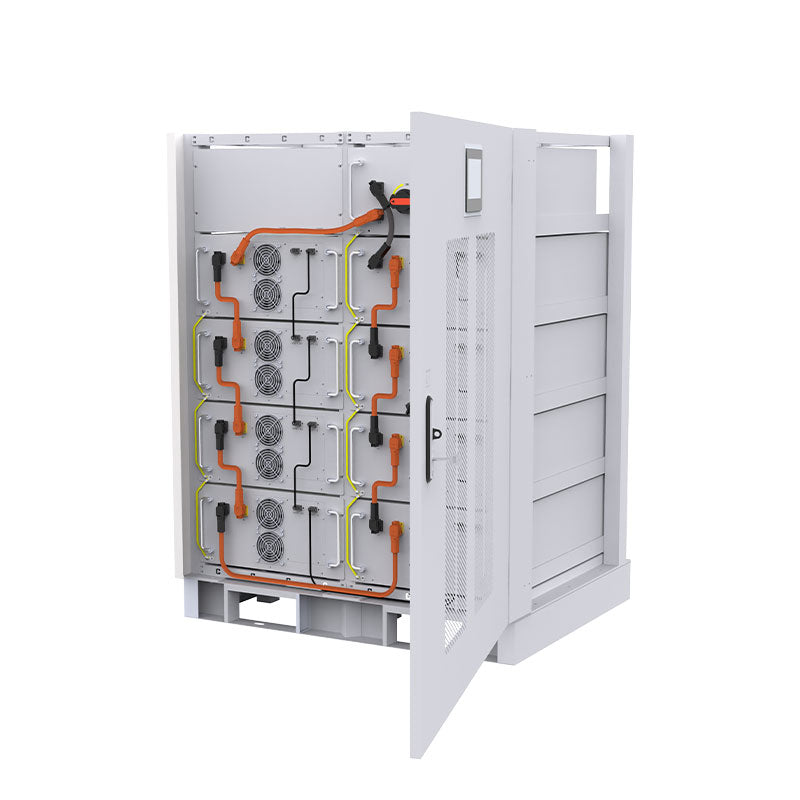
Every watt of power lost at the panel level is a watt that never makes it to your lithium battery bank. Consistent underperformance means your batteries may not reach a full charge, especially during shorter winter days. This forces you to rely more on a backup generator or conserve energy heavily, undermining the goal of energy independence. According to the IEA's report, System Integration of Renewables, having clear visibility into the system's state is essential for prudent management. These advanced audits provide exactly that visibility for your off-grid setup.
Maximizing ROI with Proactive Maintenance
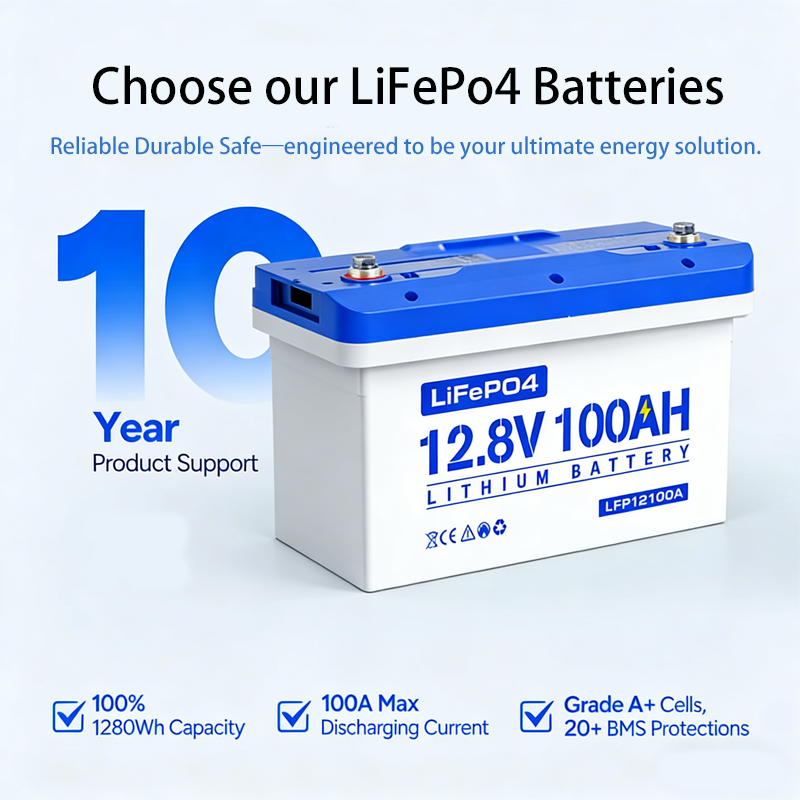
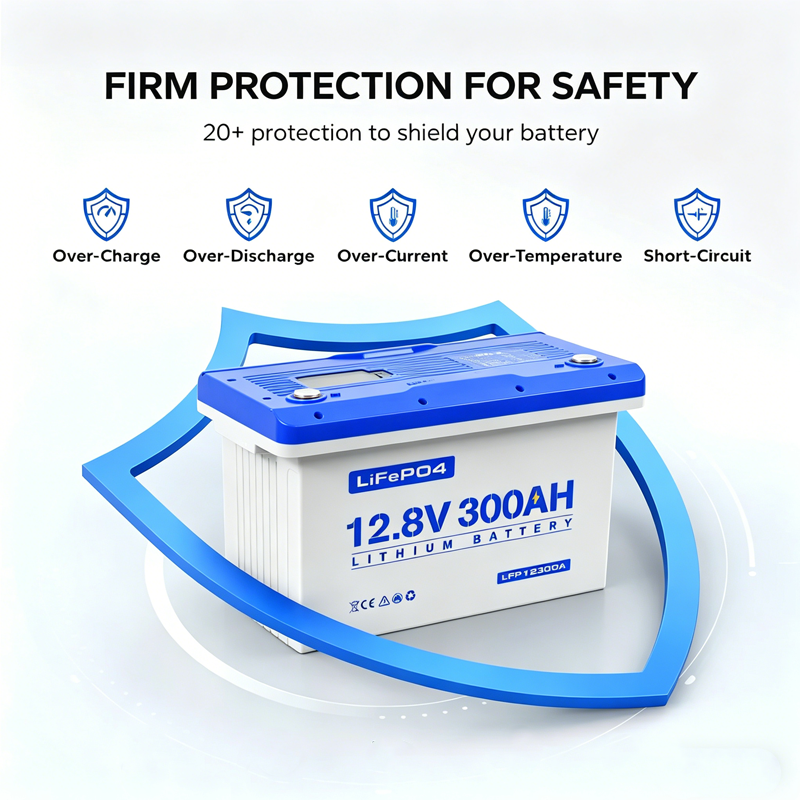
Viewing these audits as an investment in asset protection is key. Early detection of a failing bypass diode or a severely degraded panel can prevent system-wide issues and costly downtime. Maintaining peak performance ensures your high-performance LiFePO4 batteries are charged efficiently, extending their lifespan and maximizing the return on your entire solar investment. Understanding your system's real-world output is vital. You can find a comprehensive breakdown of how to measure and interpret these figures in this ultimate reference for solar and storage performance, which helps benchmark your audit results against expected values.
Moving Beyond Visual Checks for True System Health
While visual inspections and cleaning are the foundation of solar maintenance, they only tell part of the story. For owners of remote, off-grid systems who depend on every watt, incorporating advanced diagnostics is a logical next step. Thermal imaging and I-V curve tracing empower you to move from reactive fixes to proactive health management. As highlighted in the IEA's Solar Energy Perspectives, the efficiency and reliability of solar installations are paramount. Furthermore, the principles of detailed data gathering discussed in Getting Wind and Solar onto the Grid apply just as much to an independent off-grid array as they do to a utility-scale plant. By adopting these tools, you can find and fix hidden problems, secure the longevity of your equipment, and ensure your system delivers the reliable power you need for true energy independence.
Frequently Asked Questions
How often should I perform a thermal or I-V trace audit?
For most residential off-grid systems, an audit every 2-3 years or after a significant, unexplained performance drop is a good practice. Systems that power critical applications may benefit from annual checks to ensure maximum reliability.
Can I perform these tests myself?
While consumer-grade thermal cameras are becoming more accessible, interpreting the thermograms accurately requires some training and experience. I-V curve tracers are specialized, expensive instruments that require technical expertise for safe and proper use. For accurate results, hiring a qualified solar technician is often the most reliable and safest option.
What are the ideal conditions for these tests?
Both tests deliver the best results on a clear, sunny day. High solar irradiance, ideally above 800 W/m², is crucial. These conditions ensure panels are operating near their peak capacity, which makes temperature differences and electrical performance deviations much more apparent and easier to measure accurately.
Are these tools expensive?
Professional-grade thermal cameras and I-V curve tracers can be a significant capital expense. However, many solar installation and maintenance companies offer these diagnostic services at a reasonable cost. For system owners, hiring a professional is a highly cost-effective way to access this technology without purchasing the equipment.
